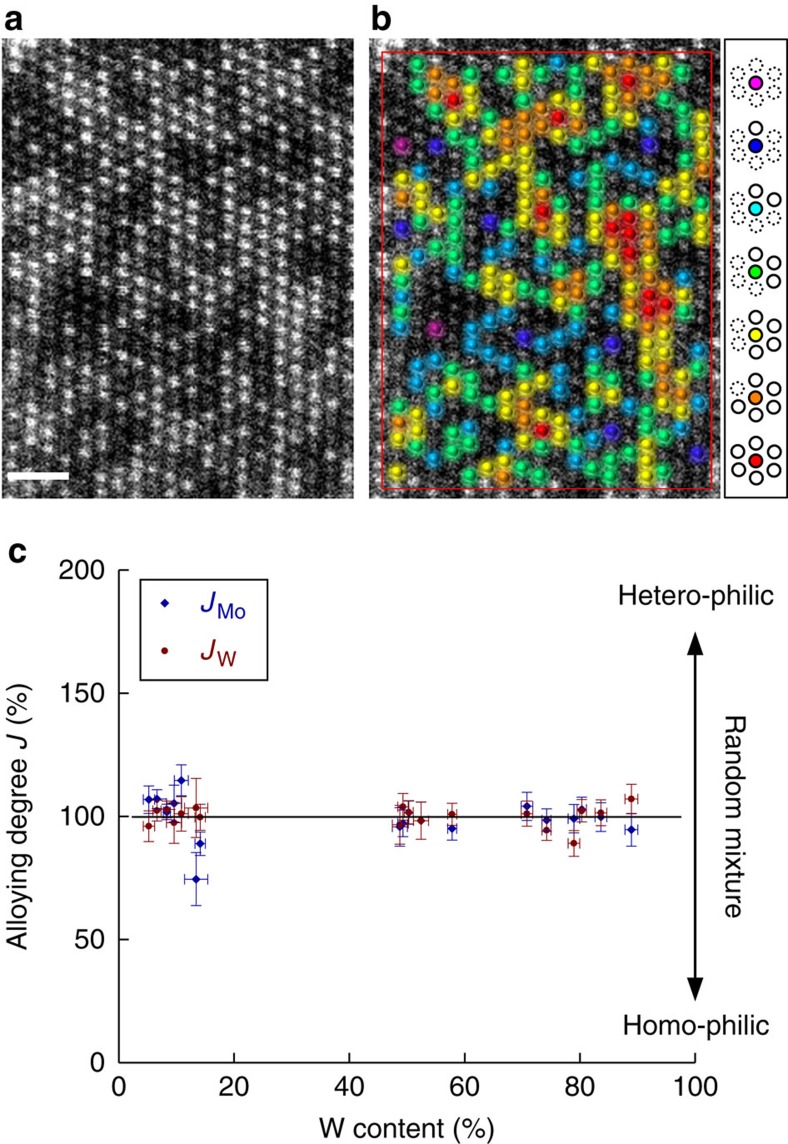
Figure 3. Quantitative analysis of atomic distributions.
(a) Example for ADF image of Mo1−xWxS2 single layer (x=0.5). The W atoms are shown in different colours on the same image (b): purple, blue, light blue, green, yellow, orange and red for six-, five-, four-, three-, two-, one- and zero-coordinate sites. (c) The alloying degrees JW and JMo thus observed throughout the wide range of W contents are close to 100%, which indicates a random mixture. Taking into consideration the statistical distribution of W and Mo atoms in a layer, the error bars for the content and alloying degree were calculated. The error bar results for content and alloying degree depend directly on a sample size showing bigger error values for samples with smaller size. Scale bar, 1 nm.

