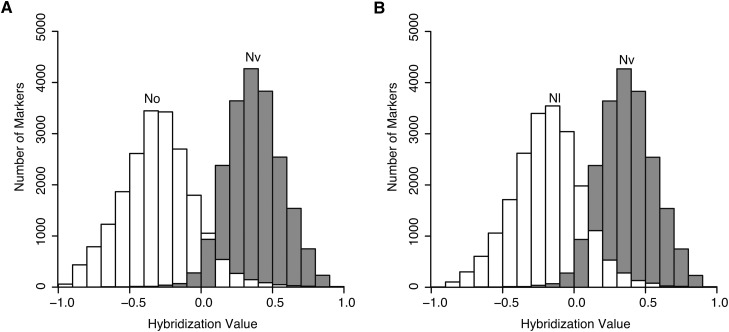
Figure 5 .
Frequency histograms of hybridization values when hybridized with (A) N. oneida (No; white) vs. N. vitripennis (Nv; gray), and (B) N. longicornis (Nl; white) vs. N. vitripennis (Nv; gray). The Y-axis shows the number of markers that produced the relevant hybridization values of the 20,551 total markers. Hybridization values > 0 indicate greater hybridization to the N. vitripennis oligo, while hybridization values < 0 indicate greater hybridization to the N. giraulti oligo. A large fraction of markers successfully discriminate between the two species pairs, as most markers produced greater hybridization to the correct oligo when hybridized with control DNA.

