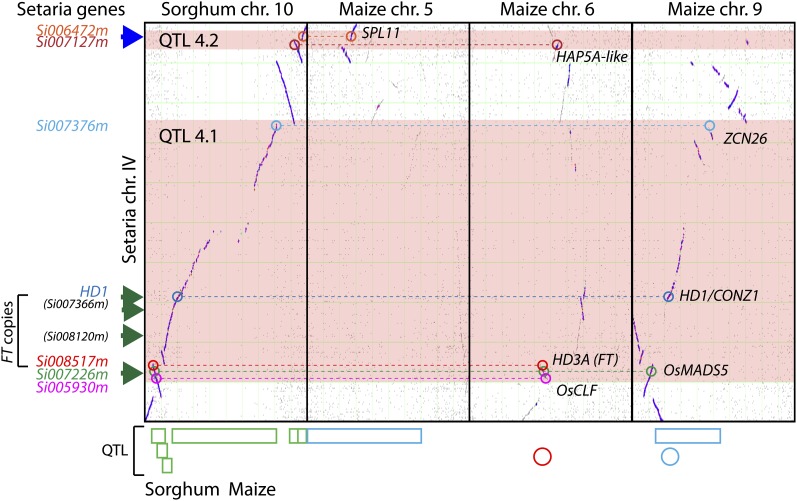
Figure 5 .
Analysis of Setaria chromosome IV and corresponding syntenic regions in sorghum and maize. Each panel represents a chromosome by chromosome dot-plot of Setaria chr. IV (vertical axis) vs., in turn, sorghum chr. 10, maize chr. 5, maize chr. 6, and maize chr. 9 (horizontal axis). Horizontal pink bars indicate genomic extent of Setaria QTL4.1 and 4.2. On the bottom axis are QTL regions identified in sorghum (Mace and Jordan 2011) and maize (Buckler et al. 2009; Coles et al. 2010). Sorghum QTL are in green boxes, maize QTL are in red or blue boxes (Coles et al. 2010) or circles (Buckler et al. 2009), with red indicating days to anthesis and blue indicating days to silking. Syntenic candidate genes identified in the Setaria sequence (SPL11, HAP5A-like, ZCN26, HD1, HD3A, OsMADS5) were mapped onto each of the syntenic regions in sorghum and maize using COGE. On the left of the graph are the Setaria proteins identified as orthologous to the candidate genes from other species. Three of the Setaria proteins are co-orthologs of HD3A/RFT1 (FT) in rice, but only Si008517 is in synteny with the four chromosomes from sorghum and maize. The other two co-orthologs, Si07366m and Si08120m, are not found in syntenic regions. HD1 is not annotated in the Setaria genome, thus there is no numbered Setaria protein associated with it. Four dark green arrows on the left hand side of the graph indicate the approximate position of the four LOD peaks in QTL 4.1 and one blue arrow the single LOD peak in QTL4.2.

