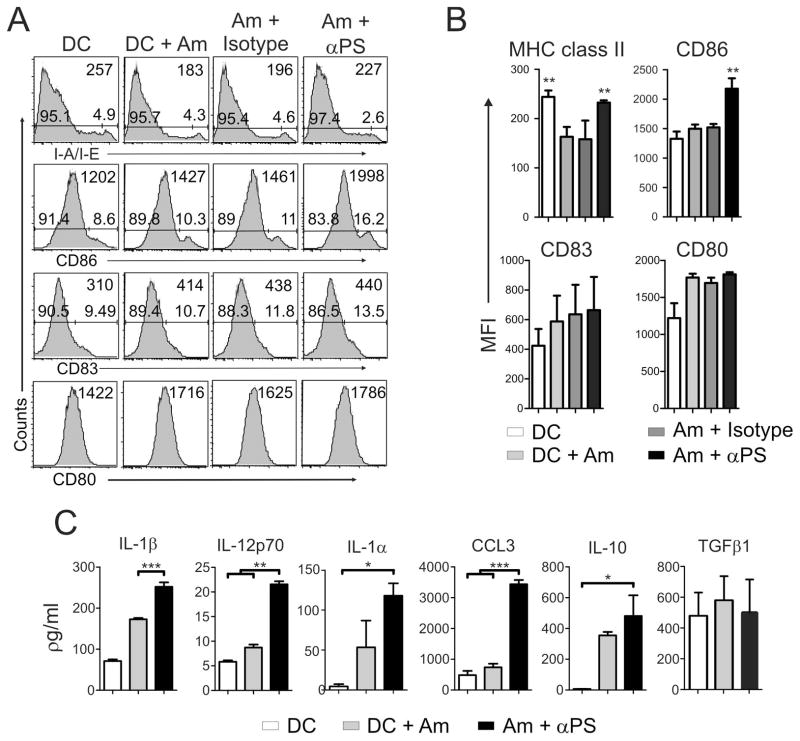
Figure 2. Blocking PS recognition boosts DC activation.
BMDCs were infected with lesion-derived amastigotes that were pre-treated with 9 μg/ml of mAb mch1N11 (αPS) or isotype control. After 24 h of infection, (A, B) DCs were harvested for the analysis of activation markers by flow cytometry, and (C) the production of cytokines in the SN was measured by a bioplex assay. (A) Graph representative of 3 independent experiments. Numbers at the upper-right of each plot represents the total population MFI of the indicated labeling. Numbers at the bottom of each plot indicate the percentage of positive/negative cells (B, C) Graph represents data from 3 pooled experiments. (B) Asterisks indicate statistical difference when compared to isotype control. Am – amastigotes. * p < 0.05, ** p < 0.01, *** p <0.001.

