
Figure 6.
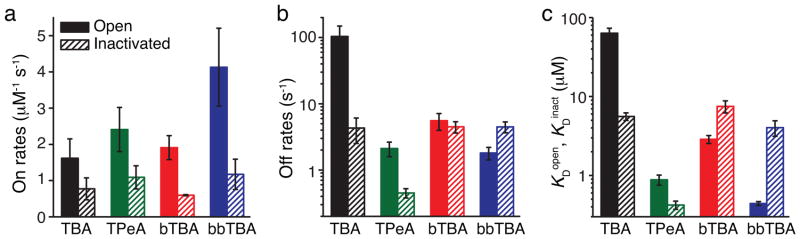
Summary of state-dependent MthK block. (a–c) Block kinetics from the state-independent access model (Scheme III) for TBA (black), TPeA (green), bTBA (red), and bbTBA (blue) are plotted for the open state (filled bars) and the inactivated state (dashed bars). Shown are the mean ± S.D. from three fitted datasets (Supplementary Table 3) for blocker on-rate (a), off-rate (b), and dissociation constants, KDopen and KDinact (c).