Figure 3.
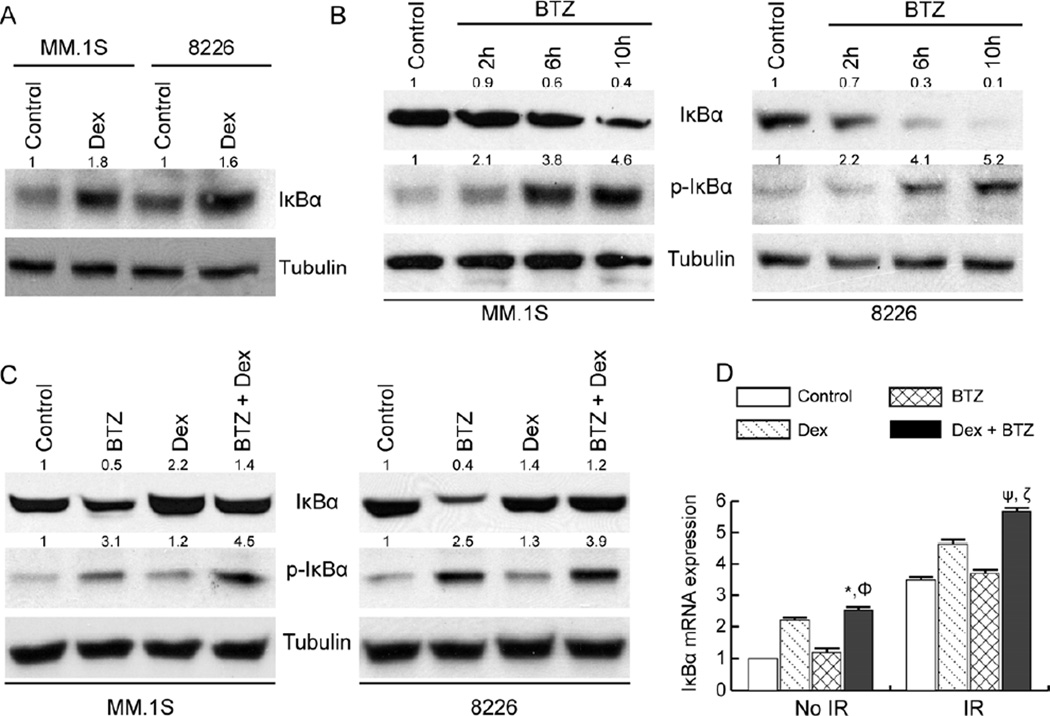
The effect of Dex and BTZ on IκBα protein and mRNA level in myeloma cells. Western blot analysis of whole cell lysates for (A) IκBα protein after Dex treatment (1 µM for 24h), (B) IκBα and p-IκBα after BTZ treatment (10 nM) at the indicated time points, and (C) IκBα and p-IκBα after Dex and/or BTZ treatment at 24h. Tubulin levels were used as loading control. Band intensities relative to respective tubulin controls, are shown above each blot. (D) qPCR analysis of IκBα mRNA in 8226 cells at 12h after treatment with Dex (1 µM) and/or BTZ (10 nM). The results are presented as the fold change in mRNA expression relative to 18S mRNA and are normalized to control, un-irradiated cells (mean of two independent experiments). *P<0.05 and ΦP<0.001 compared with Dex and BTZ respectively, ψP<0.05 and ζP<0.01 compared with Dex + IR and BTZ + IR, respectively.

