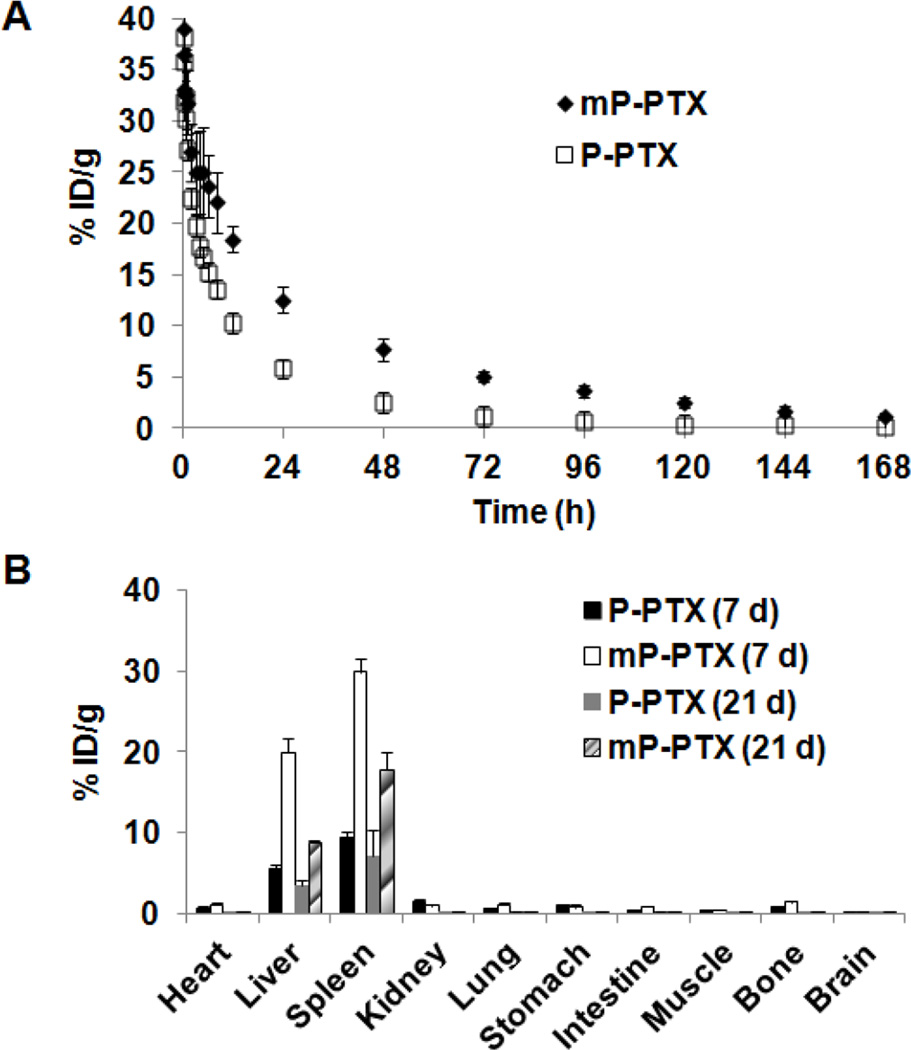
Figure 3.
(A) Blood activity-time profiles of 125I-labeled P-PTX or mP-PTX. The open circles represent the mean radioactivity expressed as a percentage of the injected dose per gram of blood from mice (n=5). (B) Biodistribution in female nude mice at 7 d and 21 d after intravenous injection of 125I-labeled P-PTX or mP-PTX. Data obtained using the radioactivity count method plotted as percentage of injected dose per gram of tissue (%ID/g). All the data are expressed as mean ± standard deviation (n=4–5).

