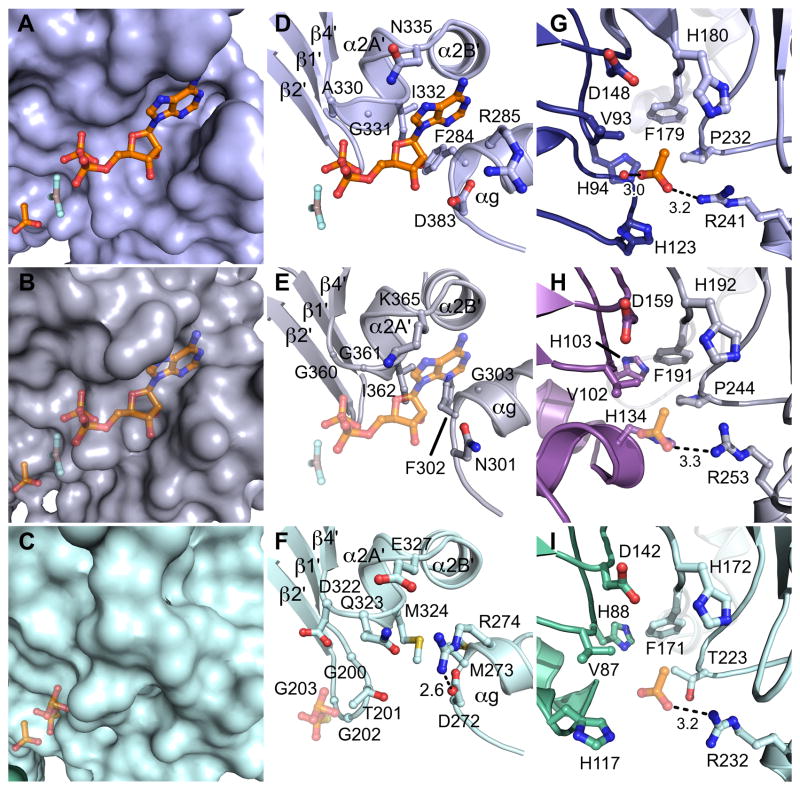
Figure 3. Active site architecture.
A) A surface representation of the M. thermophila ACK (PDB ID 1TUY) with the N-terminal wing domain colored dark blue and the C-terminal body domain colored light blue. B) A surface representation of the C. neoformans ACK colored as in Figure 2. ADP-AlF3 and acetate are modeled into putative binding sites. C) A surface representation of the E. histolytica ACK colored as in Figure 2 with PPS and acetate modeled into putative binding sites. D–F) Close up views of the nucleotide or PPi binding sites in ACKs. D) M. thermophila ACK, E) C. neoformans ACK, and F) E. histolytica ACK. In panels E) and F), the position is modeled according to methods listed in the text. G–I) Close up views of the substrate binding site. G) M. thermophila ACK H) C. neoformans ACK, and I) E. histolytica ACK. The acetate is modeled in panels H) and I).

