
Figure 1. Prevalence of NAFLD according to serum uric acid quartiles.
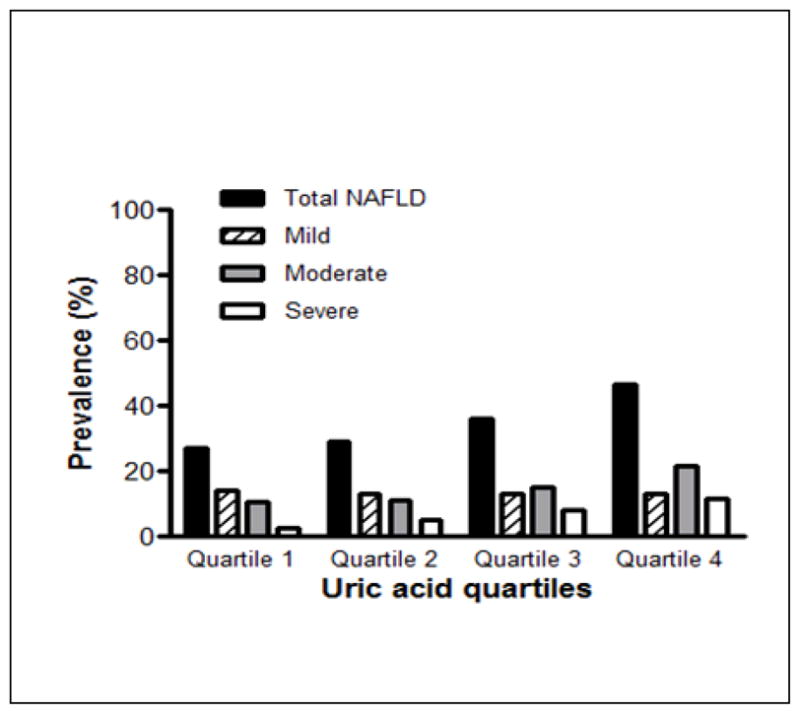
The prevalence of any grade of NAFLD on ultrasound increased with increasing serum uric quartile (p < 0.0001 for quartile 4 compared to quartiles 1,2, and 3). In addition, the p value for the Rao-Scott Chi Square test was < 0.0001 indicating that NAFLD grade was dependent on serum uric acid quartiles.