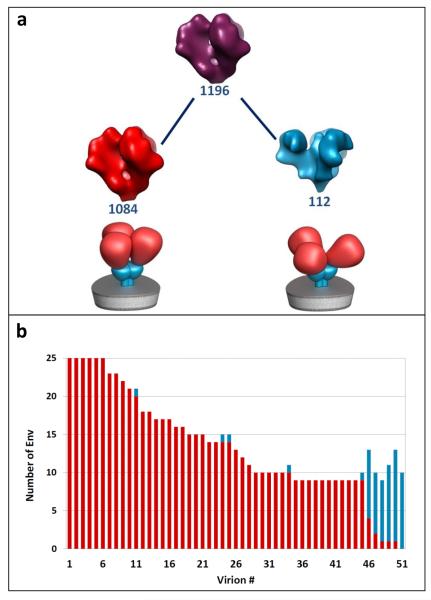
FIGURE 6.
(a) Hierarchical separation of SIV MAC 239 and SIV CP-MAC following the collaborative alignment procedure introduced in this paper. Schematic representations of two well-defined structures representing native trimeric Env in the closed conformation (SIV MAC 239) and open conformation (CP-MAC) are shown below the corresponding classes. Each node contains a density isosurface of the mean shape of the corresponding cluster in the hierarchy. The numbers in blue in each node indicate the number of shapes that belong to the cluster, respectively. (b) Virion separation bar-plot corresponding to left and right nodes of the first level in the hierarchy. For each virion, we plot a bar with height equal to the number of spikes detected on the virion. SIV MAC 239 and SIV CP-MAC portions are marked in red and cyan, respectively.

