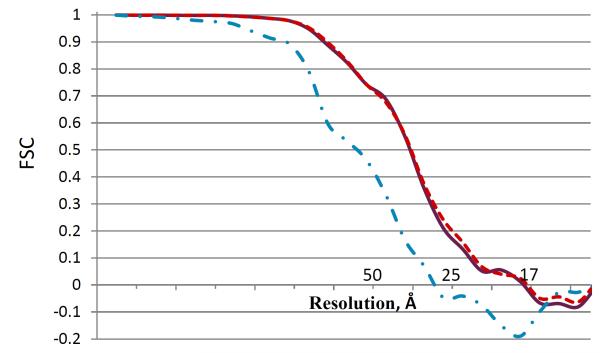
FIGURE 7.
Fourier shell correlation (FSC) plots of the root shape (purple solid line), which is a mixture of both conformations present in the data, and two shapes of the first hierarchical level corresponding to SIV MAC 239 (red dashed line) and SIV CP-MAC (cyan dot-dashed line). See Figure 6 for the shape hierarchy description.

