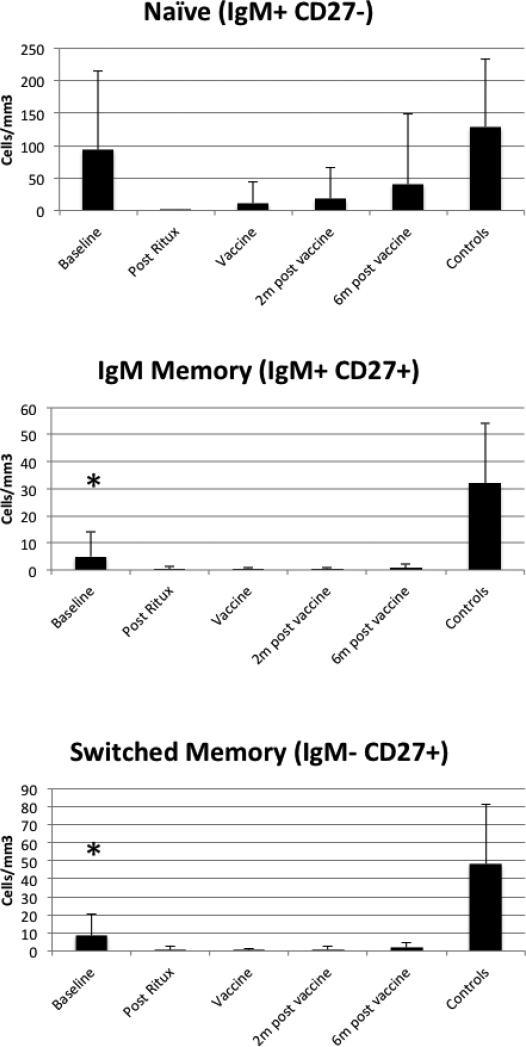
Figure 2. B cell subsets.
B cell subsets were defined using flow cytometry. The mean and standard deviation are shown and the baseline evaluations for the controls are shown at the right of each graph. Baseline levels were compared between patients and controls. The IgM memory and switched memory subsets were different from controls at baseline (p<0.001 for both). On the day of vaccination, memory subset counts were significantly lower in patients than controls with p<0.001.

