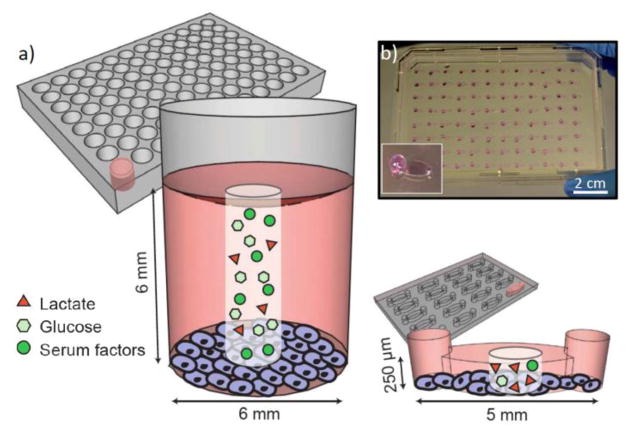
Figure 1.
a) Schematic diagram of 96-well and microchannel culture. The surface area-to-volume ratio differs by a factor of approximately seven between micro- and macroculture (1.1 mm2/μl in microchannels versus 0.15 mm2/μl in 96-well plates). When the same media is used in microchannels and 96-wells there is a seven-fold reduction in the available nutrients, such as glucose and serum factors, per cell. Conversely, the concentration of metabolic waste, such as lactate, increases more rapidly in microchannels than 96-well plates since there is less volume per cell to dilute waste products. b) Photograph illustrating an array of microchannels; inset shows one channel in detail with an aqueous drop at the channel output to facilitate passive pumping.

