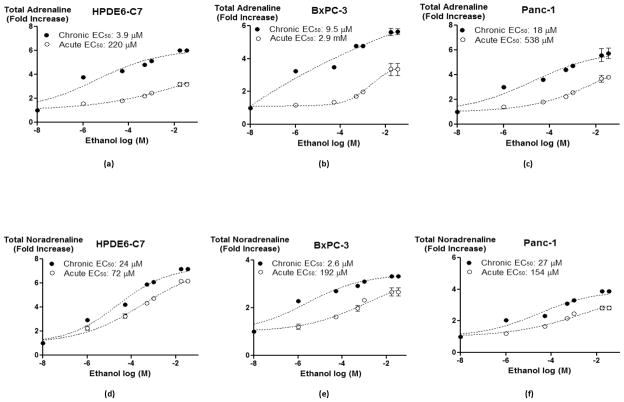
Figure 2.
Total (secreted and intracellular) adrenaline (a–c) and noradrenaline (d–f) levels in cells treated with single doses of ethanol from 1 μM to 35 mM for 30 minutes or pretreated with 17 mM ethanol for 7 days and then exposed to identical concentrations of ethanol. Data points are mean and +/− SD from five samples per treatment group.

