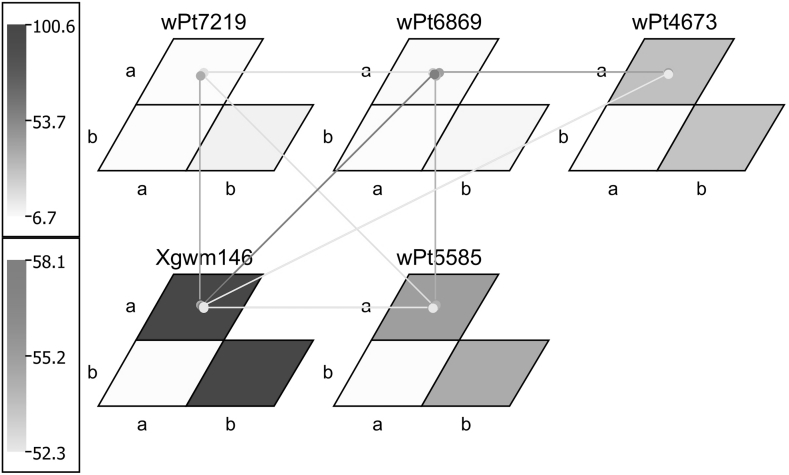
Fig. 3.
Graphical representation of QTL interactions for leaf rust infection in greenhouse for BBG/BP rust race in terms of matrices and connecting lines showing genotype matrices (GMs) and genotype matrix networks (GMNs). Significant locus/allele combinations of interacting loci are shown by GMs and GMN. Matrices and connecting lines indicate GMs and GMNs, respectively. Magnitude of the F-measure of combination and single locus/alleles effects, respectively, is shown by a color code

