
Figure 1.
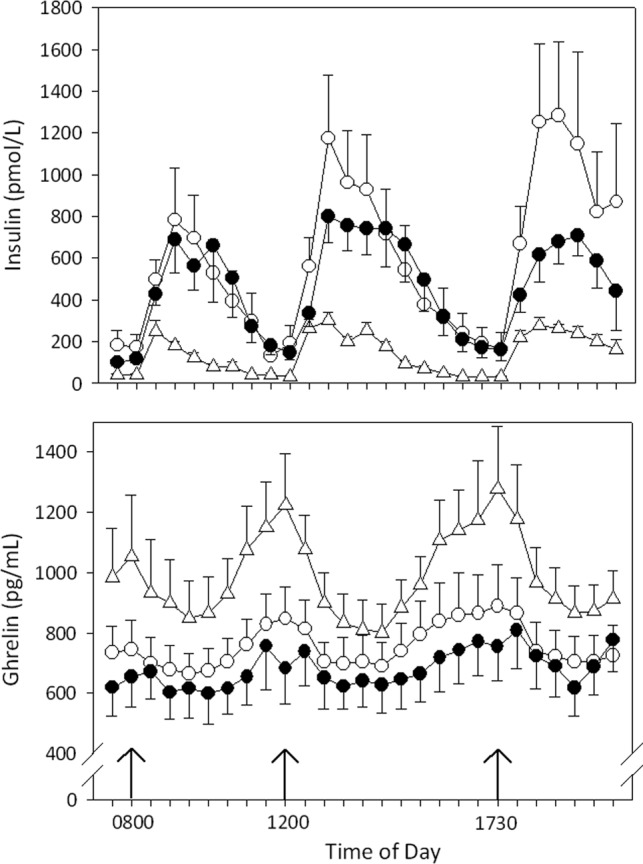
Insulin (upper graph) and total ghrelin (lower graph) concentrations in 6 lean controls (triangles), 6 obese subjects (open circles), and 6 obese patients with MC4R deficiency (closed circles) during a 12-h sampling period with 3 meals standardized for macronutrient and caloric content. Meals were provided at 8 am, noon, and 5:30 pm (arrows). Samples were taken every 30 min. Results are expressed as mean ± SE.