
Figure 2.
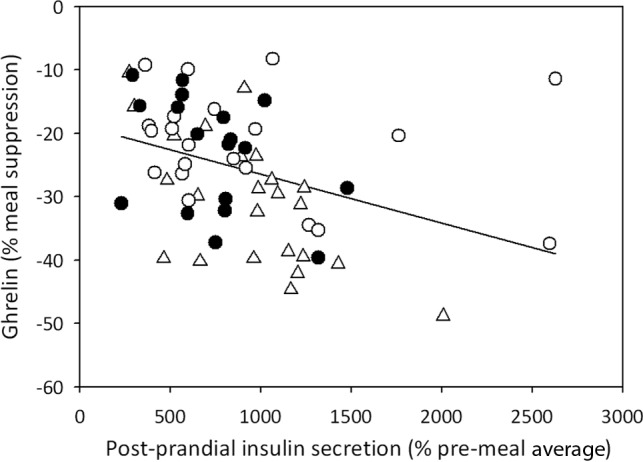
Correlation between percentage of postmeal insulin secretion and percentage of total ghrelin suppression in lean controls (triangles), obese controls (open circles), and obese subjects with MC4R deficiency (closed circles). Each data point represents a different meal (n = 63). Pearson R = −.37; P = .003.