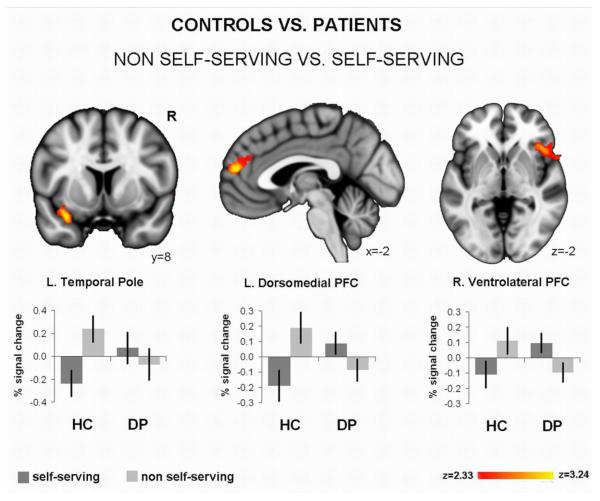
Figure 2.
Imaging results: Illustration of the group difference regarding non self-serving vs. self-serving attributions. The bar graphs (% signal change per condition) show that neural activation in a fronto-temporal network relates to non self-serving attributions in healthy controls (HC; N=15) whereas in depressed patients (DP; N=15) this activation is associated with self-serving attributions.

