Fig. 2.
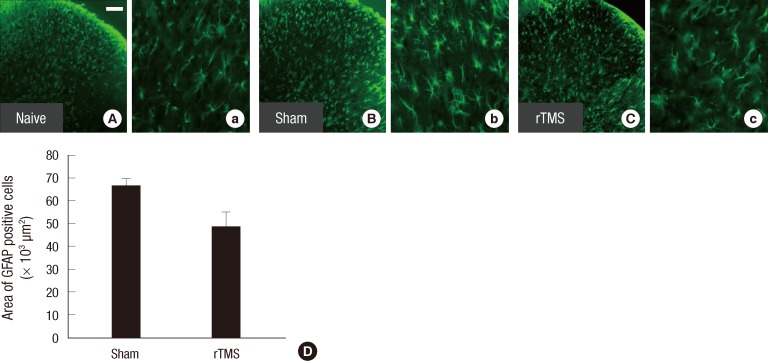
Expression of GFAP in the spinal dorsal horns. The spinal dorsal horns were from (A) naive control, (B) sham, and (C) rTMS groups. Immunoreactity for GFAP increased in the spinal dorsal horns of L4-5 segments after SCI (B). At higher magnification, reactive astrocytes with increased immunoreactivity and hypertrophy were noted (b). Reactive astrocyte numbers, GFAP expression, were lower in rTMS than in sham group (C and c). Size of scale bar: 100 µm (D). Quantitative analysis of the number of GFAP immunereactive cells in spinal dorsal horns. In quantitative analysis of numbers of GFAP, the immunoreactive positive area was significantly lower in the rTMS group, than in sham group (P = 0.009). Results are presented as mean ± SDs.

