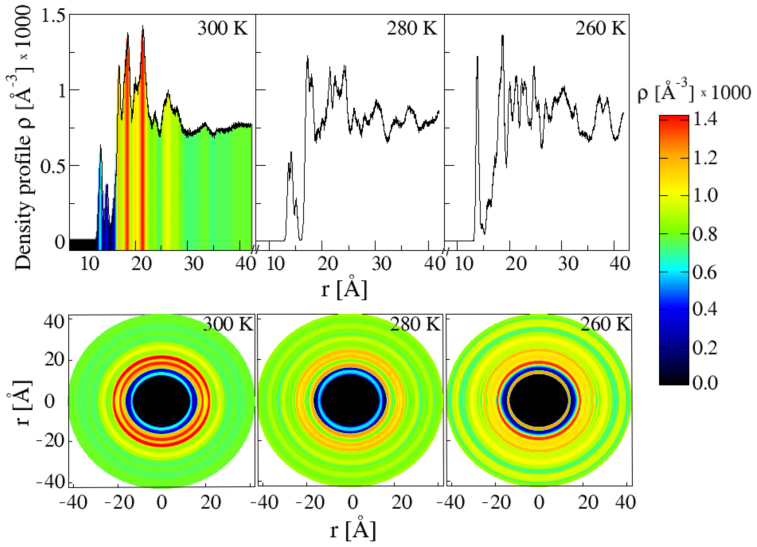
Figure 6. Density profile of trehalose molecules around the lysozyme and colour heat maps.
(Top panels) Density profile of the COM of trehalose molecules around the COM of the lysozyme at (left) T = 300 K, (middle) T = 280 K and (right) T = 260 K. The density profile is obtained dividing the number of trehalose molecules found between r and r + Δr by the volume of the corresponding spherical shell 4π[(r + Δr)3 − r3]/3, with Δr = 0.02 Å. (Bottom panels) Colour heat map (see scale on the right side) of the 2D projections of the density profile of trehalose molecules around the lysozyme. As an example the density profile at T = 300 K in the top left corner is coloured using the same scale.

