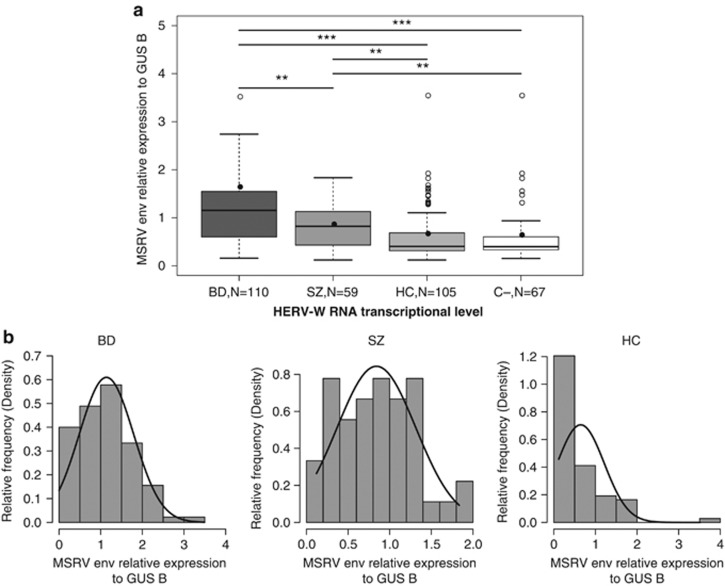
Figure 1.
Human Endogenous Retrovirus type-W (HERV-W) RNA transcriptional level. (a) HERV-W env RNA expression in patients and control groups. The relative transcription of Multiple Sclerosis-associated Retroviral element (MSRV)-env RNA to the housekeeping gene GUS B is indicated on the y axis; it measures the standardized and relative transcriptional activity in all peripheral mononuclear cells samples defined as 2E(Ct GUS B−Ct MSRV-env) (See Patients and methods). Patients and control groups are indicated on the x axis: BD, bipolar disorder; SZ, schizophrenia; HC, healthy controls without psychiatric history; C-, subset of HC group with C-reactive protein below the normal threshold in serum. **P⩽0.01 ***P⩽0.0001. (b) Distribution of HERV-W RNA expression levels in patients and control groups. y axis represents the density of corresponding HERV-W env RNA relative expression values on the x axis, giving a description of their distribution in each group (BD, SZ, HC). Density curve: the area under a density curve (between the curve and the horizontal axis) is always defined as 1 unit. The area under the density curve between two values is the proportion of observations in the data set that fall between those two values. Histogram: the distribution frequency of results between two values is represented by bars.

