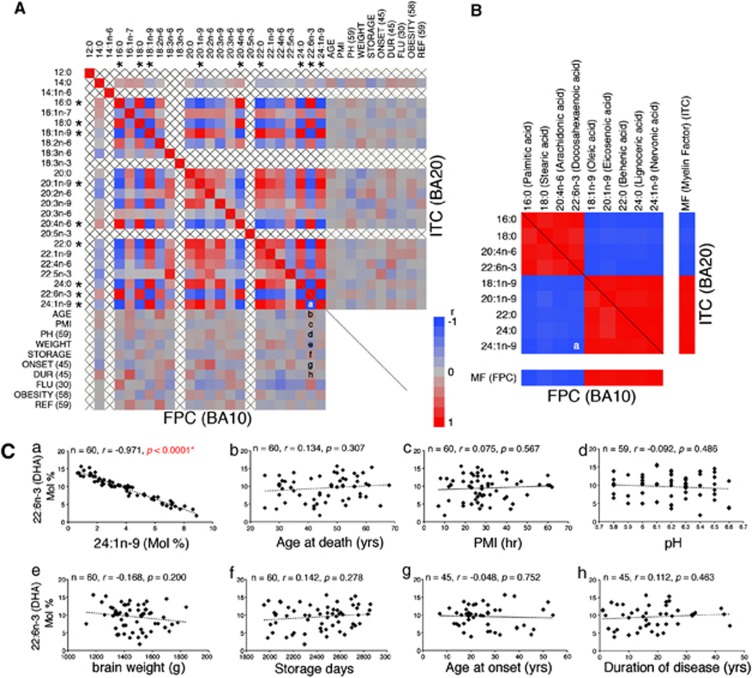
Figure 1.
Effects of myelin inclusion or confounding factors on the human brain fatty acid (FA) composition. (A) Pearson's correlation coefficient matrix of 24 FAs for all available countable confounding factors of frontopolar cortex (FPC) (left, bottom) and inferior temporal cortex (ITC) (right, top) samples. Correlations are expressed by the respective color tiles. Note that none of the available countable confounding factors significantly affected FA composition, whereas the nine major FA concentrations (marked with an *) showed multicollinearity (|r|>0.8), probably due to inadvertent myelin inclusions. AGE, age at death; ONSET, age at onset; DUR, duration of disease (years); FLU, fluphenazine equivalent (mg); PH, brain pH; WEIGHT, brain weight (gram); PMI, post-mortem interval (hours); STORAGE, frozen storage (days); and OBESITY, obesity index. Letters in the matrix (A and B) indicate the position of graphs in panel C (for example, a=Figure 1Ca). (B) Rearranged correlation coefficient matrix of the marked FAs and myelin factors (MFs) for FPC (left, bottom) and ITC (right, top) samples. (C) Correlation between 22:6n-3 (docosahexaenoic acid (DHA)) concentration (mol%) and (a) 24:1n-9 concentration (mol%), (b) age at death, (c) PMI, (d) pH, (e) brain weight, (f) frozen storage days, (g) age at onset and (h) duration of disease. Note that only the 24:1n-9 concentrations correlated significantly with those of DHA (P<0.0001), suggesting that the concentrations of one FA (for example, DHA) can be predicted by other FA concentrations (for example, 24:1n-9) (see the results of multiple regression analyses in Supplementary Table 2).

