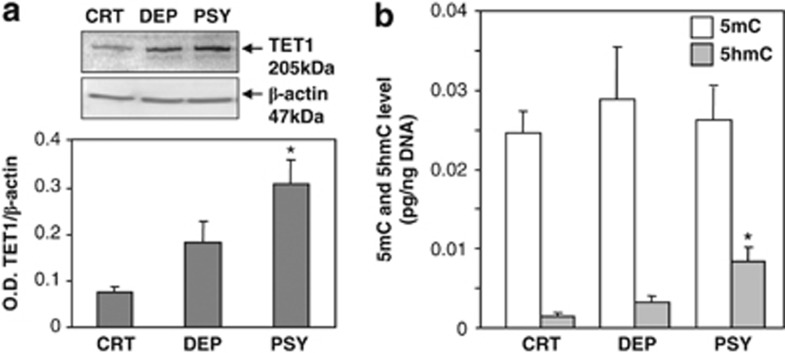
Figure 2.
(a) Ten-eleven translocation (TET)1 protein expression in the nonpsychiatric (CTR), depressed (DEP) and psychotic (PSY) group. In the inset is the representative gel image of western blot of TET1 and β-actin. The TET1 protein expression was increased in the PSY group compared with the CTR group: *P<0.01 (one-way analysis of variance (ANOVA)). Each value represents mean±s.e.m. of the optical density (OD) ratio of TET1 protein vs β-actin. (b) Levels of 5-methylcytosine (5mC) and 5-hydroxylmethylcytosine (5hmC) expression in total DNA isolated from the CTR, DEP and PSY groups. Each value represents the OD ratios of 5mC and 5hmC immunostaining (calculated from their corresponding standard curves) and the DNA loaded on the membrane (calculated from standard curve). The 5hmC level was increased in the PSY group compared with the CTR group (*P<0.01), while 5mC levels failed to change. The data represent the mean±s.e.m.

