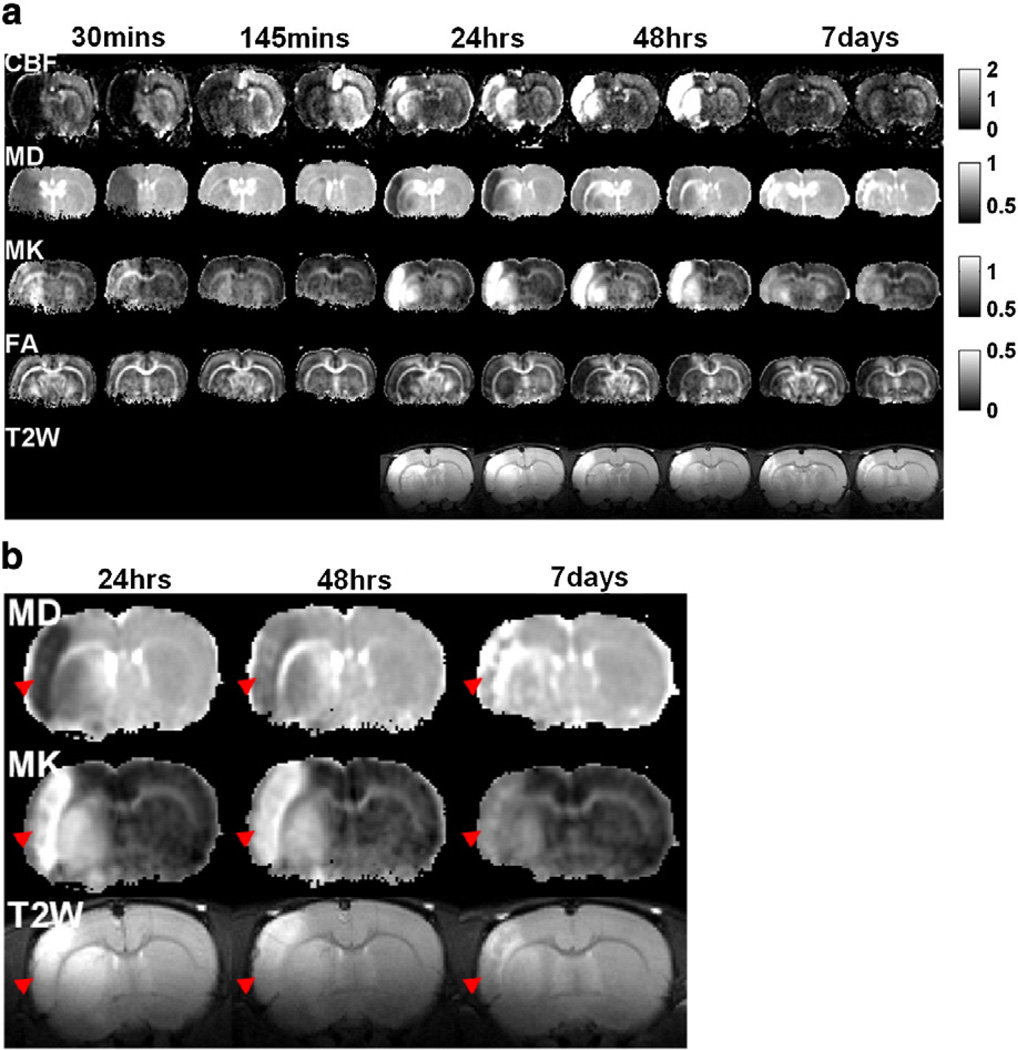
Fig. 5.
(a) CBF, MD, MK, FA maps and T2W images (two brain slices) of a rat subjected to transient MCAO obtained at 30, 145 min, 24, 48 hrs and 7 days after occlusion. The MCAO duration was 45 min. (b) Enlarged MD, MK maps and T2W images of one slice in (a) at 24, 48 hrs and 7 days after occlusion. Red arrowheads indicate the area of the cortex which showed the much slower pseudonormalization of MK than MD and T2W signal. Maps across all time points were displayed with the same scale. Units for CBF and MD are ml/g/min and µm2/ms.

