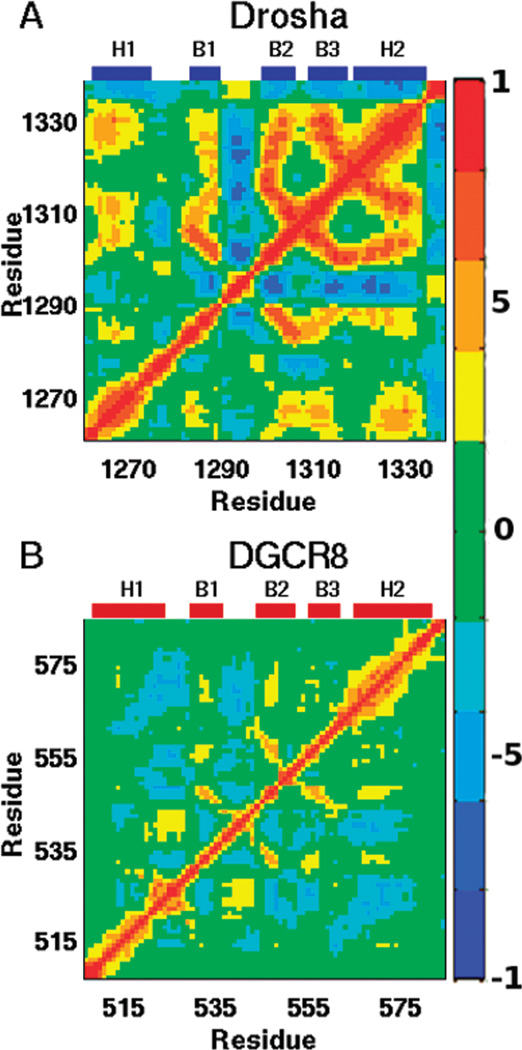
Figure 7.
Cα correlation matrices reveal the collective backbone motions of (A) Drosha-dsRBD and (B)DGCR8-dsRBD1. The color bar on the right shows the scale indicating strong positive correlation (red), strong negative correlation (blue), and noncorrelated motion (green). Labels above each panel indicate the location of secondary structural elements within the sequence.

