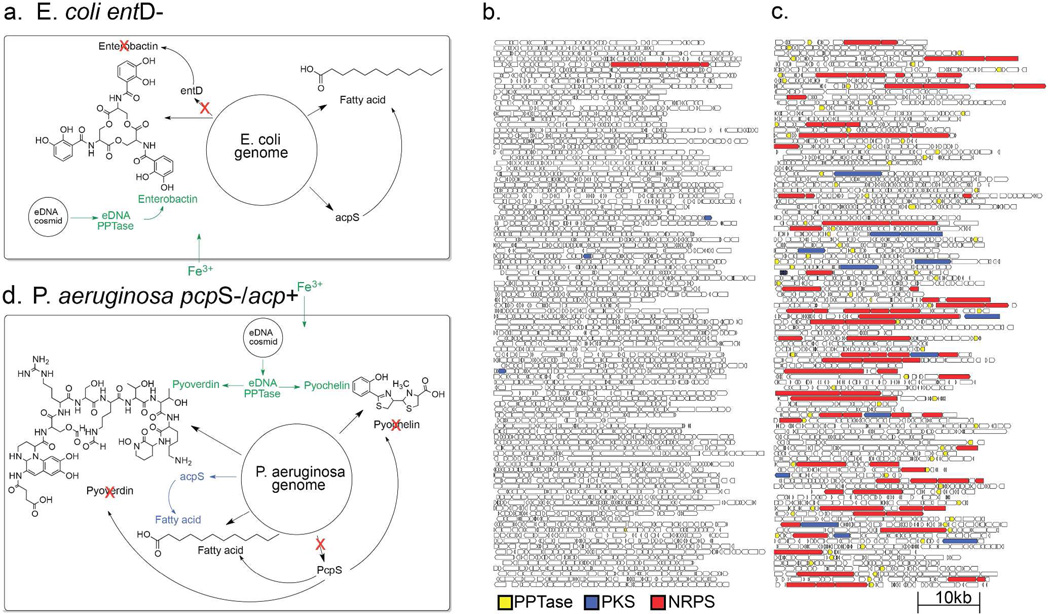
Figure 2. Library enrichment schemes and sequencing.
(a) E. coli PPTase selection scheme. One hundred cosmid clones from un-enriched (b) and E. coli PPTase enriched (c) eDNA libraries. PPTase (yellow), NRPS (red) and PKS (blue) genes are colored. (d) P. aeruginosa PPTase selection scheme. Genome positions in (a) and (d) are not drawn to scale.

