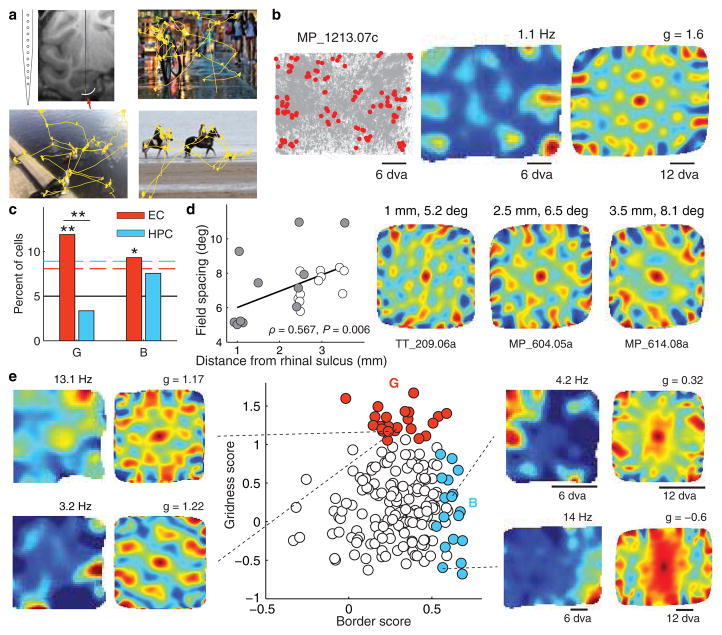
Figure 1. Spatial representation in the primate entorhinal cortex.
a. Recordings were performed using a linear electrode array placed in the entorhinal cortex (red arrow). Three example 10-second scan paths are shown in yellow. b. An example of an entorhinal grid cell. Left: plots of eye position (gray) and spikes (red) reveal non-uniform spatial density of spiking. For clarity, only spikes corresponding to locations of firing rate above half of the mean rate were plotted. Monkey name and unit number are indicated by the characters at the top. Middle: spatial firing rate maps show multiple distinct firing fields. The maximum of the rate map (red) is given at the top. Right: the spatial periodicity of the firing fields is seen with spatial autocorrelations. The color scale limits are ±1 (blue-red), the maximum correlation magnitude, with green being 0 correlation. g = gridness score, dva = degrees of visual angle. c. Percentages of cells in the EC and HPC with a significantly high gridness score (G), or border score (B). The black line shows the 5% chance level, the dashed lines represent the 95% confidence level; *P < 0.05, **P < 0.01. d. Grid cell spacing increased with distance from the rhinal sulcus, consistent with a dorsal-ventral gradient in rodents and bats. Open and closed circles identify the grid cells from each of the two monkeys. Right: autocorrelations for representative grid cells recorded at different locations medial to the rhinal sulcus. e. Gridness and border scores are plotted for all cells recorded in the posterior EC (n = 193; red: cells with significant gridness scores, n = 23; blue: cells with significant border scores, n = 18).

