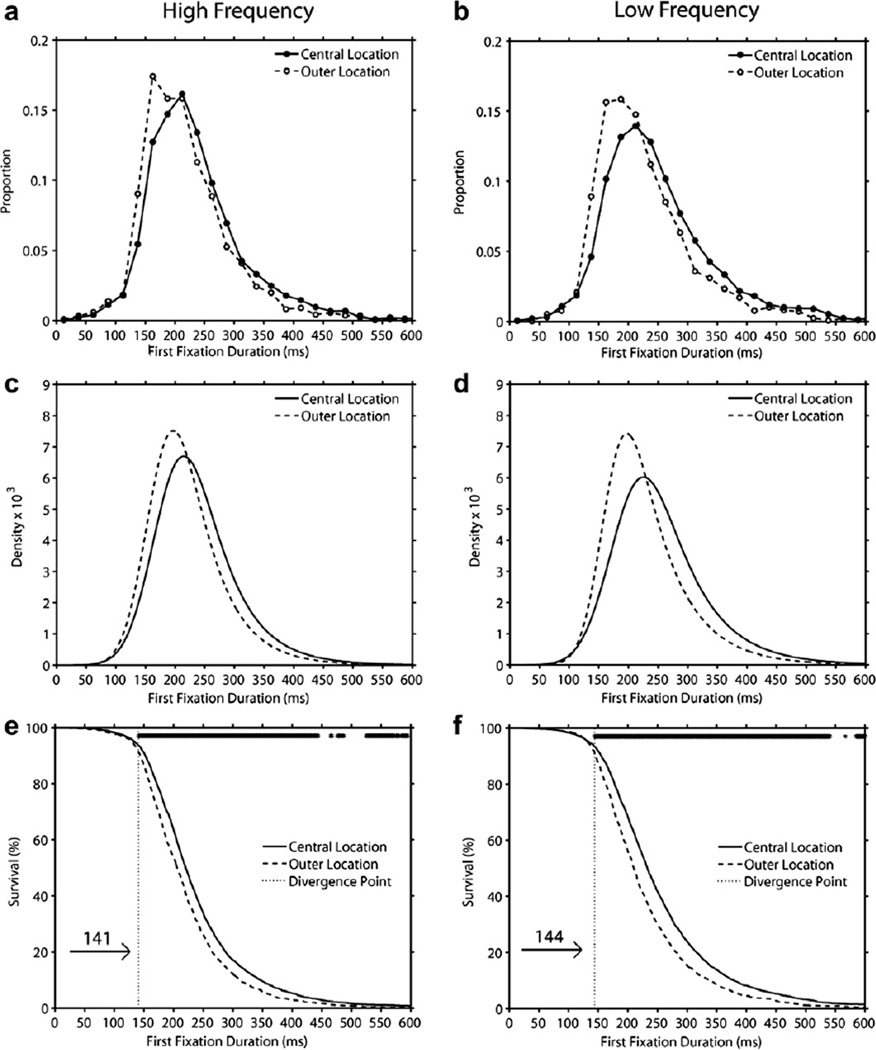
Fig. 8.
Distributions of first fixation duration on central-location and outer-location in high-frequency trials (Panel a) and low-frequency trials (Panel b), and ex-Gaussian density functions (Panels c–d), and survival curves (Panels e–f) that were generated from these distributions (the row of asterisks at the top of Panels e–f indicate time bins with a significant difference between the central and outer location curves). See text for details.

