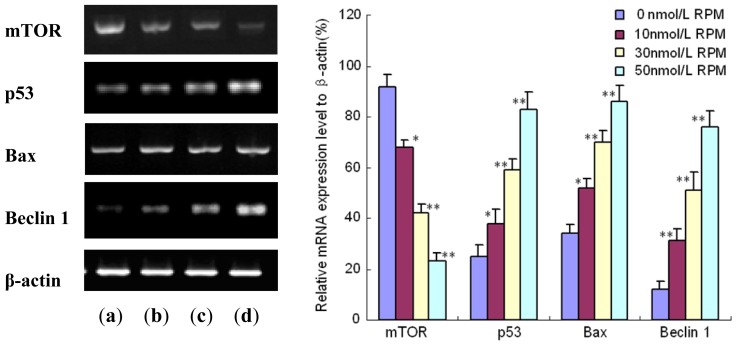
Figure 5.
The mRNA expression of mTOR, p53, Bax and Beclin 1 in PC-2 cells treated with different concentrations of Rapa: After treatment with different doses of Rapa for 24 h, mRNA level was detected by semi-quantitive RT-PCR analysis. This assay was done quintuplicate. Values represent means ± standard deviations and were determined using the Student’s t-test. * p < 0.05 and ** p < 0.01 versus 0 nmol/L Rapa group. (a) 0 nmol/L Rapa group; (b) 10 nmol/L Rapa group; (c) 30 nmol/L Rapa group; (d) 50 nmol/L Rapa group.

