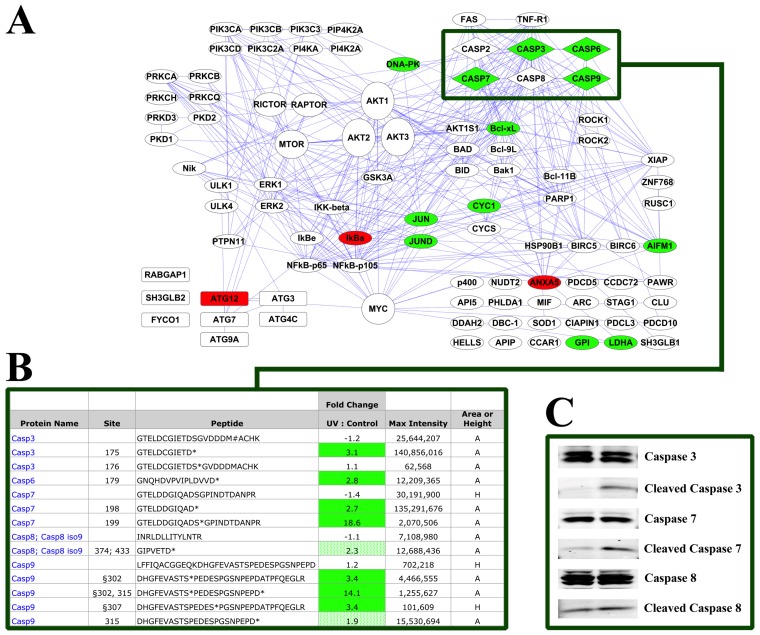
Figure 5.
Apoptosis/Autophagy Reagent HeLa −/+ UV Results. (A) Quantitative data from replicate runs was mapped onto the pathway diagram from Figure 2. Green proteins denote peptides that increased at least 2.5-fold with UV damage, and red proteins denote decreases of at least 2.5-fold. The green box highlights caspase proteins; (B) Selected peptides derived from caspases are shown in detail with modification/cleavage site number, peptide sequence, fold change (UV: Control), maximum intensity and whether the measurement was height (H) or area (A). Green cells represent peptides that increased with UV damage at least 2.5-fold. Light green cells indicate increases in cleaved caspase peptides less than 2.5-fold. Total antibodies are available for protein names shown in blue text; (C) Western blotting of the same samples used for the PTMScan Direct analysis with caspase 3, 7 and 8 antibodies (Cell Signaling Technology).

