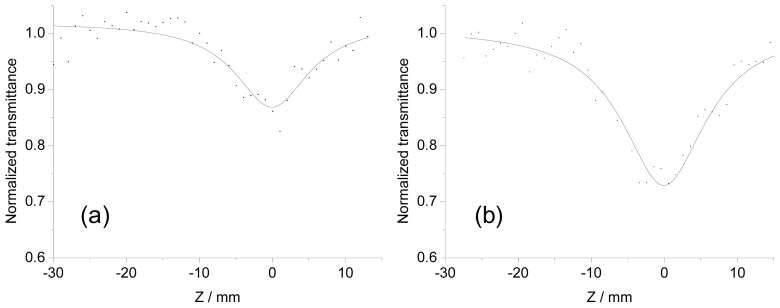
Figure 4.
Typical open-aperture Z-scan traces for 1P (dotted trace) and theoretically fitted curves (solid line) at 890 nm (a at a concentration of 7.66 × 10⁻⁵ M in 1,1,2,2,-tetrachloroethane with a pulse energy of 1.6 mJ) and 760 nm (b at a concentration of 6.87 × 10⁻⁵ M in 1,1,2,2,-tetrachloroethane with a pulse energy of 1.45 mJ).

