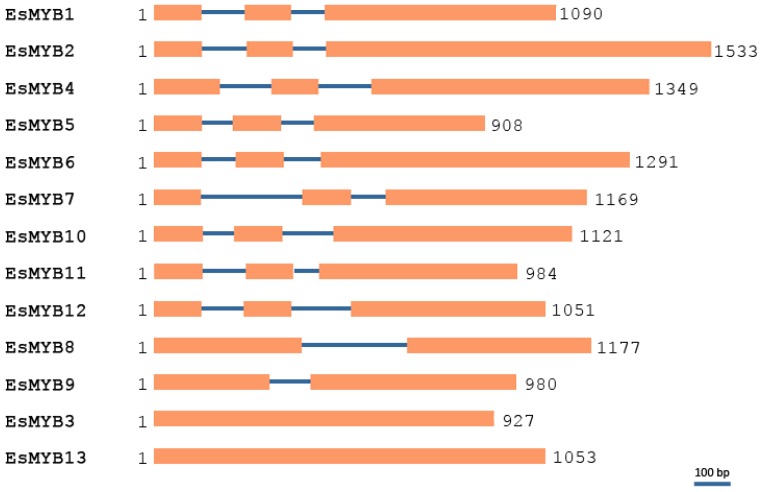
Figure 3.
Genomic structures of 13 R2R3-MYB genes from E. sagittatum. Exons and introns are shown in boxes and lines, respectively. The numbers at the left and right side indicate the position of the translation start codon and stop codon, respectively. The scale represents 100 bp length in nucleotide. Detailed information about exon and intron length and splice junction site is seen in Table S1.

