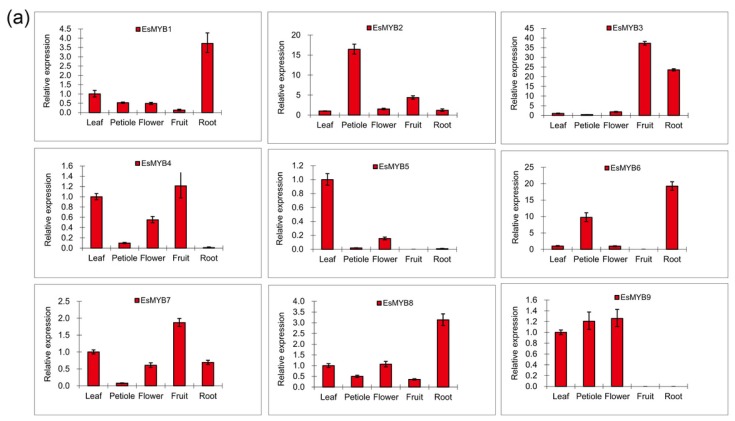
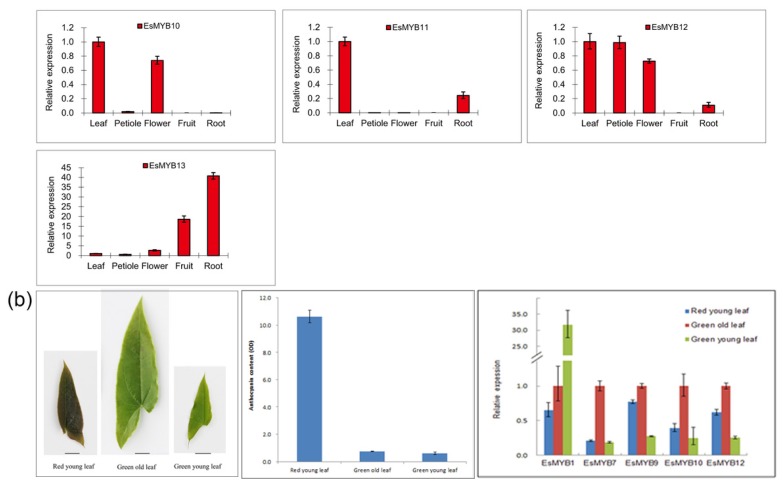
Figure 4.
Expression patterns of 13 R2R3-MYB genes from E. sagittatum in various tissues. (a) The mRNA expression patterns of 13 Epimedium R2R3-MYB genes in leaf, petiole, flower, fruit and root tissues are examined by qPCR assay. The comparative Ct method is used to determine the relative expression, and the expression level of gene in leaf tissue is set to “1”. (b) Five Epimedium R2R3-MYB genes (EsMYB1, EsMYB7, EsMYB9, EsMYB10 and EsMYB12) are selected to determine their mRNA expression levels by qPCR assay (right) in the red and green leaf tissues (left) which accumulate different amount of anthocyanin (middle). Three samples are used from two plants for qPCR assay, and the red young leaf and green old leaf are collected from the same plantlet at differential developmental stages, while the green young leaf is collected from another plantlet at the same developmental stage of the red young leaf. Bar = 1 cm. Total anthocyanin content is determined using spectrophotometric method, and the column represents the mean value and SD (standard deviation) indicating from three replicates. The comparative Ct method is used to determine the relative expression level, and the expression level of gene in green old leaf is set to “1”.


