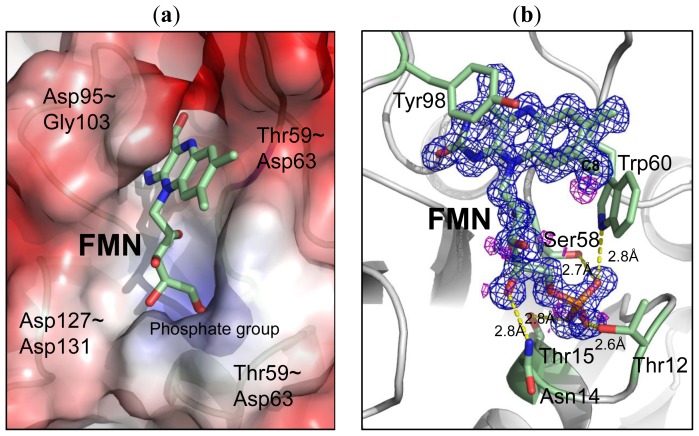
Figure 3.
The co-factor FMN. (a) The electrostatic surface shows the charge distribution of the FMN-binding site with the displayed potentials range from −107 (red) to 107 (blue) kTe−1. Four loops involved in the formation of the binding pocket are labeled; (b) The electron density (composite-omit map with 2Fo–Fc, contour level = 1.2 σ, blue) of FMN reveals a high quality of the refined structure with a density hole of the isoalloxazine ring. The major interactions between residues and the FMN are labeled with dash lines (yellow). The Fo–Fc difference map (magenta, contour level = 2.5σ) showed only an extra electron density near C8 of FMN.

