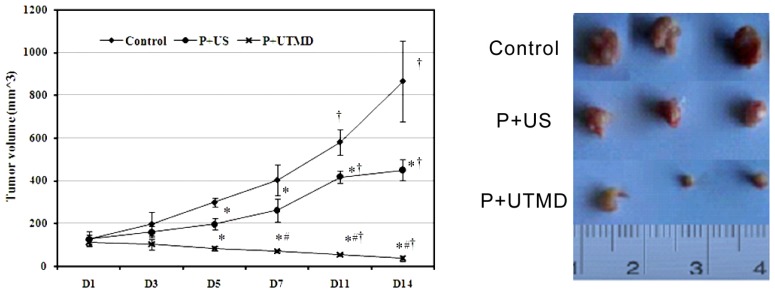
Figure 1.
Comparison of the tumor volume in different groups. Control: control group; P + US: plasmid + ultrasound irradiation group; P + Ultrasound-targeted microbubble destruction (UTMD): plasmid + microbubble + ultrasound irradiation group; D1–D14: day 1–day 14; At the same time point, as compared with control group, * p < 0.05; as compared with P + US group, #p < 0.01; as compared with D1, †p < 0.01.

