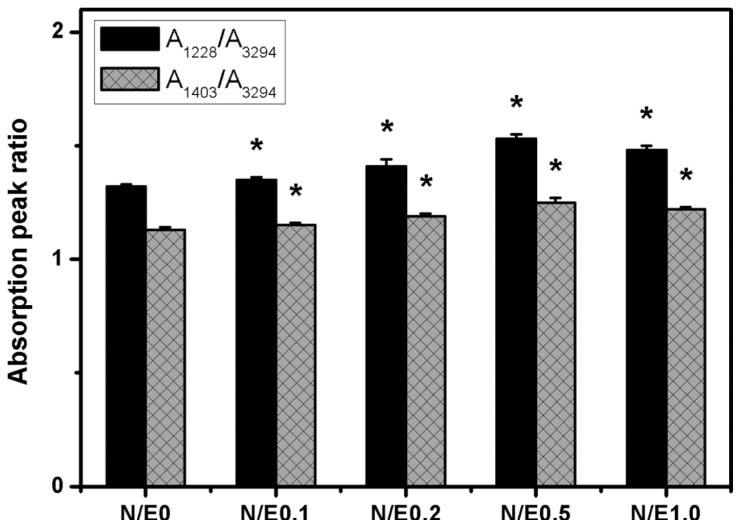
Figure 1.
The absorption peak ratios of the S=O stretching to N–H stretching bands (A1228/A3294) and C–O stretching to N–H stretching bands (A1403/A3294) in Fourier transform infrared spectroscopy for the gelatin/chondroitin sulfate (CS) samples modified at different NHS/EDC molar ratios. An asterisk indicates statistically significant differences (*p < 0.05; n = 3) vs. N/E0 (compared only within A1228/A3294 or A1403/A3294 groups).

