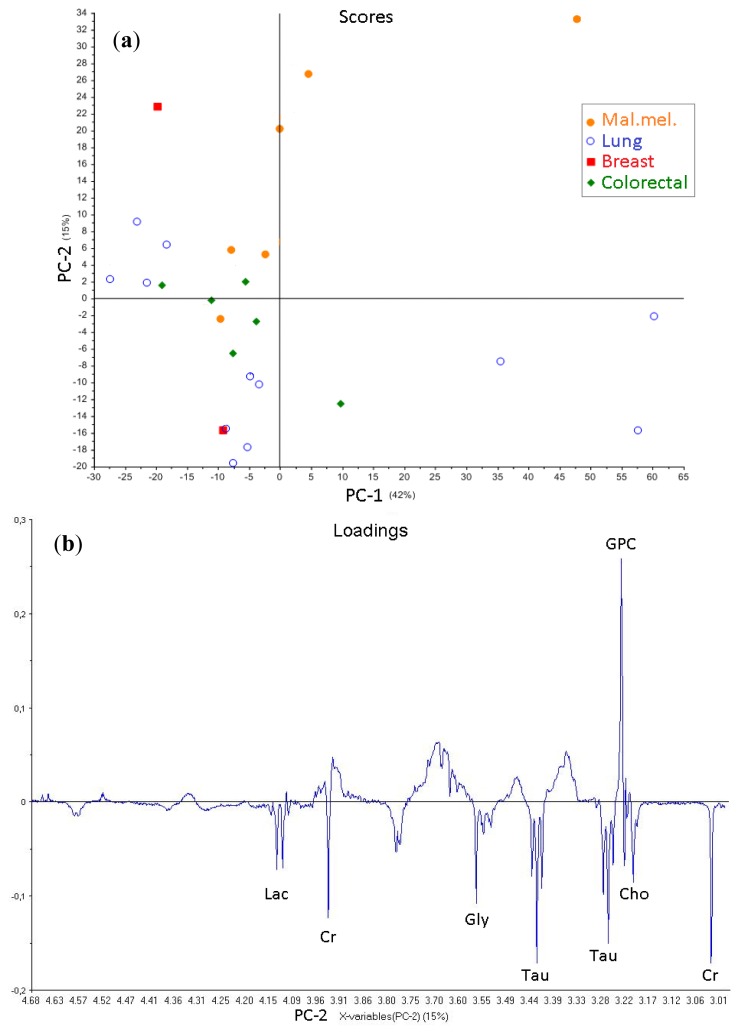
Figure 5.
(a) PCA score plot showing PC-1 (42%) and PC-2 (15%) of cpmgpr spectra (ppm region 4.68–2.98) from brain metastases with less than 50% necrotic tissue (n = 26); (b) The loading plot of PC-2 indicates the metabolites GPC, Cr, Tau, Gly, Cho and Lac as important signals that divide the subtypes. The positive dominating signal in the loading plot for PC-1 (not shown) was PCho, explaining the dispersion in PC-1 direction in the score plot.

