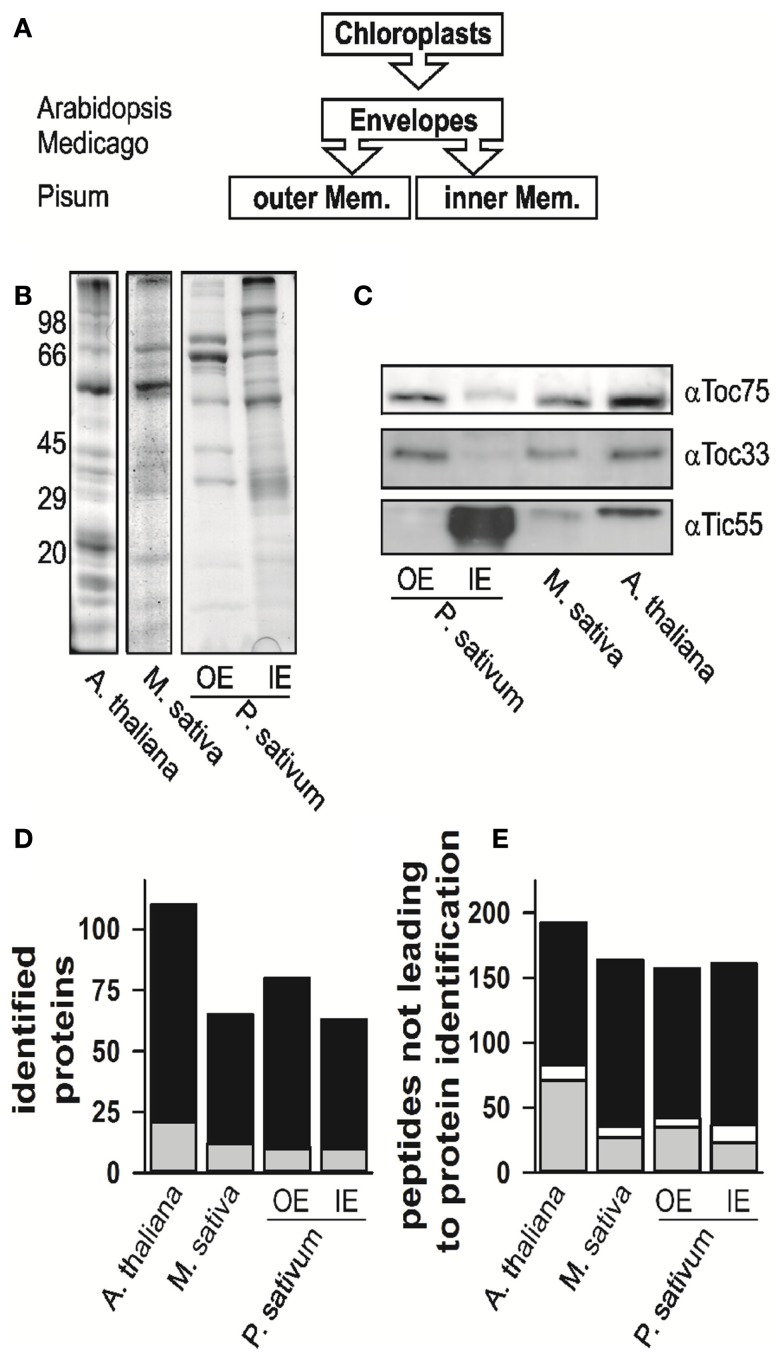
Figure 1.
The proteome analysis. (A) Schematic representation of which fractions were isolated and analyzed. The different species are indicated for the envelope fraction results of six independent replicates, three after trypsin and three after elastase digestion were combined. (B) The fractions of mixed envelope of A. thaliana and M. sativa as well as the outer (OE) and inner envelope (IE) membrane of P. sativum were subjected to SDS-PAGE analysis followed by Coomassie Blue staining. The migration of the molecular weight standard is indicated on the left. (C) The purity of the fractions in (B) was assessed by Western blotting using indicated antibodies. (D) Numbers of proteins identified in the according fractions by MALDI nano-LC-MS/MS and the two digestion methods indicated. Gray indicates the portion for which more than one AGI was assigned for one protein family, in white the portion where more than one isoform was specifically identified for one protein, black indicates the portion for which one AGI was assigned. (E) Numbers of peptides not assigned by MALDI nano-LC-MS/MS and BLAST assignment. Gray indicates the portion of peptides, which were assigned to one amino acid sequence only, whereas white indicates the portion of peptides, which were assigned to various proteins, black indicates the portion of peptides, which were not assigned at all.

