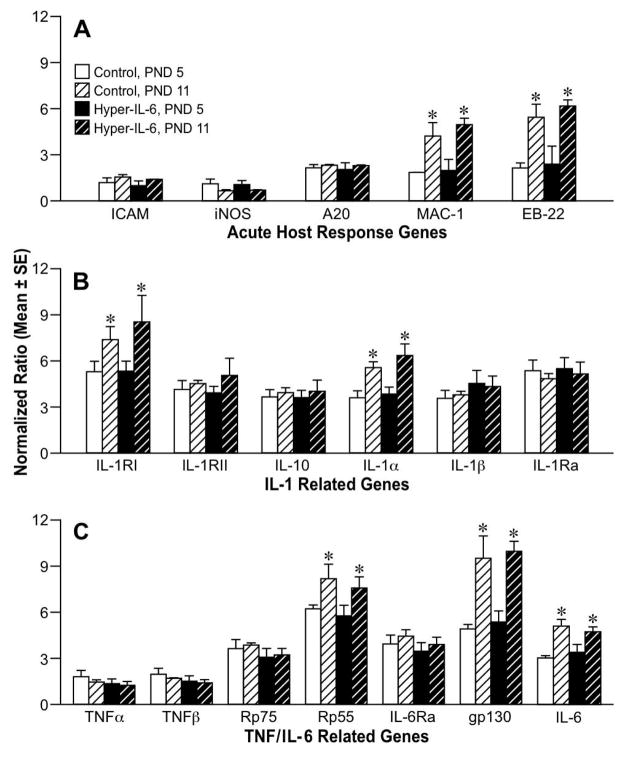
Figure 3.
RNase protection assay for (A) acute response genes and inflammatory cytokines ICAM-1, iNOS, A20, MAC-1 and EB22 (B) Interleukin 1 related genes and (C) TNF and IL-6 related genes on total RNA isolated from cortex at PND5 and 11 from mice injected with vehicle or HIL-6 5ng at PND4. Values represent normalized mean ratio of pixel volume determined by phosphor-imaging for each transcript (± SE) to corresponding L32. *Significantly different across age within exposure group, p<0.05.

