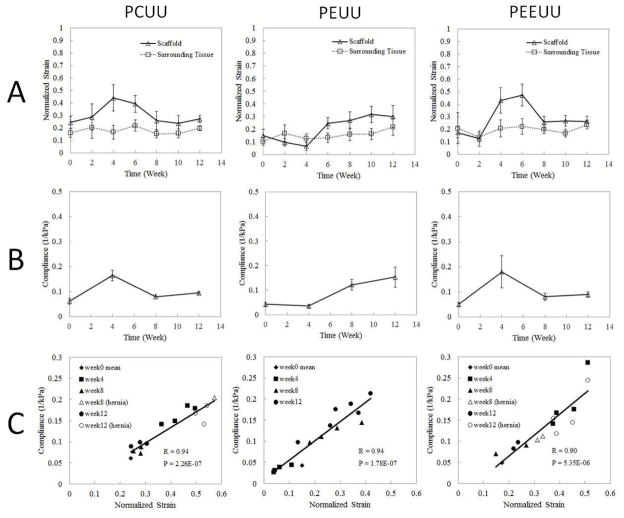
Fig. 3.
Average strain and compliance over time. (A) Normalized strain obtained from UEI for scaffold averaged over 8 samples (except when scaffold develops hernia) and surrounding tissue over time. Lines between two adjacent points are simple connection, not interpolation of data. (B) Mean compliance (1/elastic modulus) from compression tests at weeks 0, 4, 8, 12 (scaffolds with hernia are excluded). Lines between two adjacent points are simple connection, not interpolation of data. (C) Scatter plots of the compliance and normalized strain values based on the same samples at corresponding time points. R is the correlation coefficient and P is the p-value for the correlation between compliance and normalized strain. Samples with hernia are represented by open symbols.

