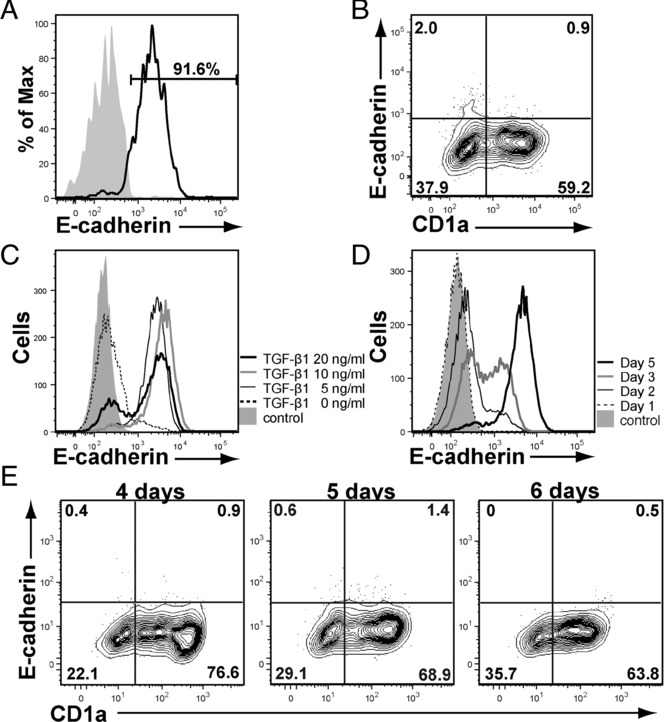
Figure 2.

E-cadherin expresses on KCs and TGF-β1-treated LC-like cells. (A) E-cadherin expression on KCs was determined by staining with HECD-1 antibody (IgG1) and analyzed by flow cytometry. Isotype-matched antibody was used for control staining. (B) DCs generated from PBMos with 10 ng/mL IL-4, 100 ng/mL GM-CSF for 6 days (6-day-DCs) were stained with anti-CD1a and anti-E-cadherin. (C) E-cadherin-expression on PBMos cultured with IL-4, GM-CSF and various concentration of TGF-β1 (0–20 ng/mL) for 6 days is shown. (D) The kinetics of E-cadherin expressions on LC-like cells generated from PBMos with IL-4, GM-CSF, and 10 ng/mL TGF-β1 are shown. (E) Effect of addition of 10 ng/mL TGF-β1 on PBMo-derived DC precursors cultured for more than 4 days. Results shown are representative of four independent experiments.
