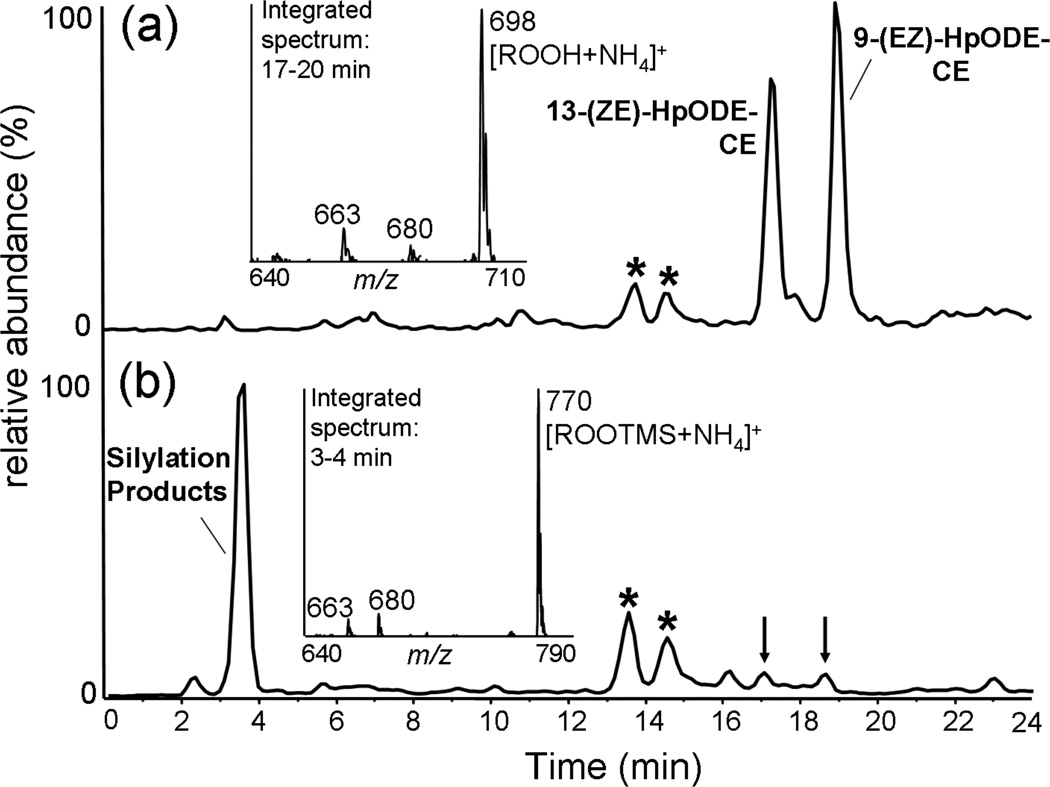
Figure 1.
NP-HPLC separation of 9- and 13-HpODE-CEs before and after trimethylsilylation. Chromatograms are total positive ion currents of precursors of m/z 369.3 scanning (m/z 650–800) of the starting material mixture (A) and the derivatization products (B). The asterisks indicate 9- and 13-oxo-ODE-CE impurities, the arrows indicate residual underivatized 9- and 13-HpODE-CE. Insets: Integrated mass spectra, averaged over the elution windows of both major peaks from m/z 640 to 710.

