
Figure 3.
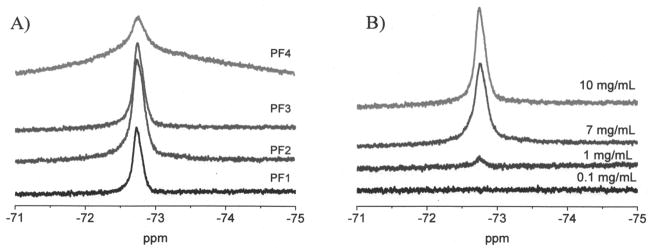
A) 19F NMR spectra of PF1 to PF4 in H2O and DMSO (98:2 by volume) at 10 mg/mL. Chemical shift is referenced to CF3COOH. B) 19F NMR spectra of PF3 at different concentration in the 2% of DMSO aqueous solutions.
Official websites use .gov
A
.gov website belongs to an official
government organization in the United States.
Secure .gov websites use HTTPS
A lock (
) or https:// means you've safely
connected to the .gov website. Share sensitive
information only on official, secure websites.
A) 19F NMR spectra of PF1 to PF4 in H2O and DMSO (98:2 by volume) at 10 mg/mL. Chemical shift is referenced to CF3COOH. B) 19F NMR spectra of PF3 at different concentration in the 2% of DMSO aqueous solutions.