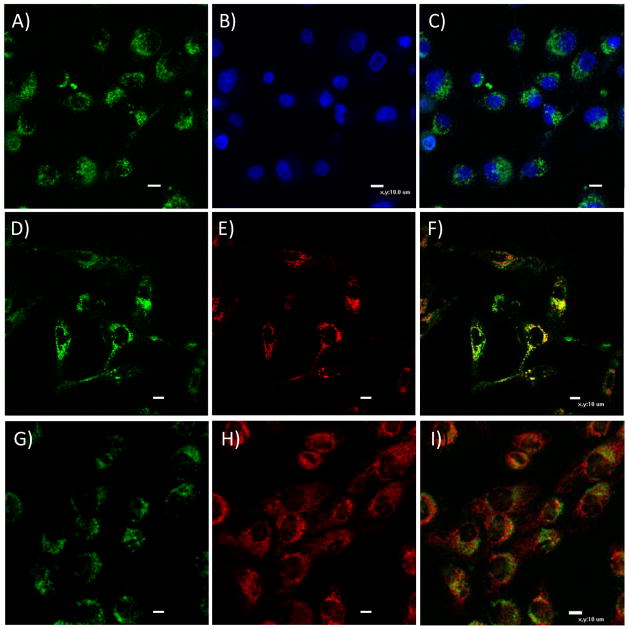
Figure 5.
Confocal fluorescence images of PF3 in CP-A cells co-stained with nuclei staining Hoechst 33342 (A, B, and C), LysoTracker Red® (D, E, and F), and MitoTracker® (G, H, I), respectively. A, D, and G represent the green channels from the AIE fluorophores. B is from the blue channel of the nuclei staining agent of Hoechst 33342. E is from the red channel of the lysosome specific LyosTracker Red®. H is from the red channel of the mitochondria specific MitoTracker Red®. C is the overlay of A and B. F is the overlay of D and E. I is the overlay of G and H. The scale bar represents 10 μm. For better resolution, C, F, and I were magnified and given in supplementary figures of S-Figure 4, 5, and 6.

