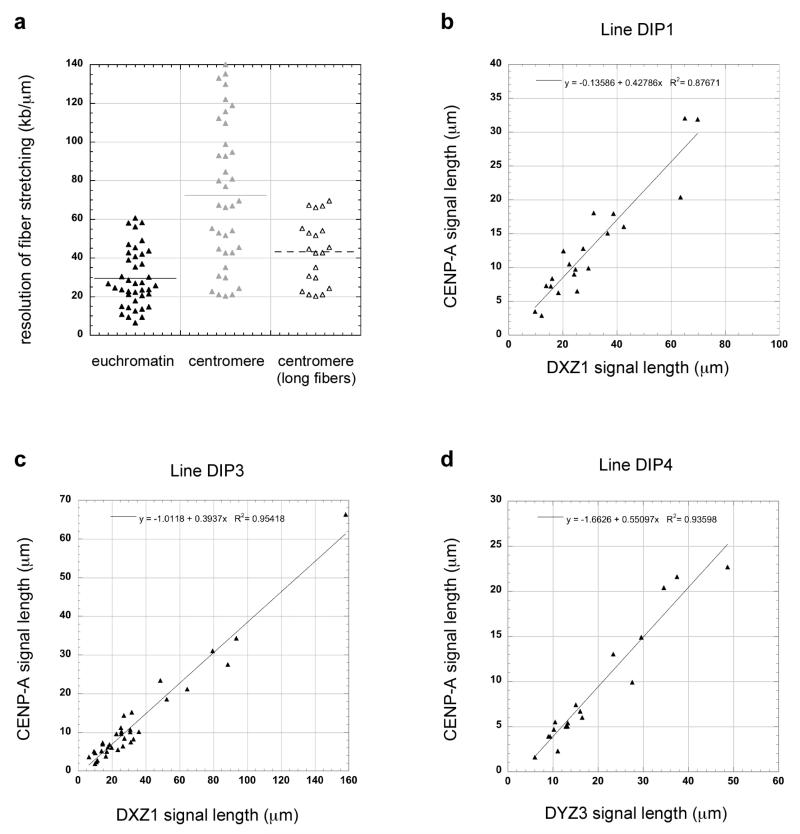
Figure 1. Range of centromeric fiber stretching and relationship between CENP-A immunofluorescence and centromeric fiber length.
(a) Comparison of chromatin fiber resolution (kb/μm) in a representative euchromatic region (HSA6) versus a centromere (DXZ1) showed that there was more variability in stretching within centromeric regions. When only long centromeric fibers (i.e. those that spanned multiple fields of view) were exclusively analyzed, euchromatic and centromeric regions were stretched to similar extents. Graphs show the linear relationship between increasing fiber length and fluorescence for centromeres. CENP-A immunofluorescence (y-axis) and alpha satellite fluorescence (x-axis) was plotted for DXZ1 in two representative cell lines (b) DIP1 and (c) DIP3 and for (d) DYZ3 in a third cell line DIP4. Linear regression was performed using Kaleidagraph software. The R2 values and equation for the line are indicated on each graph.

