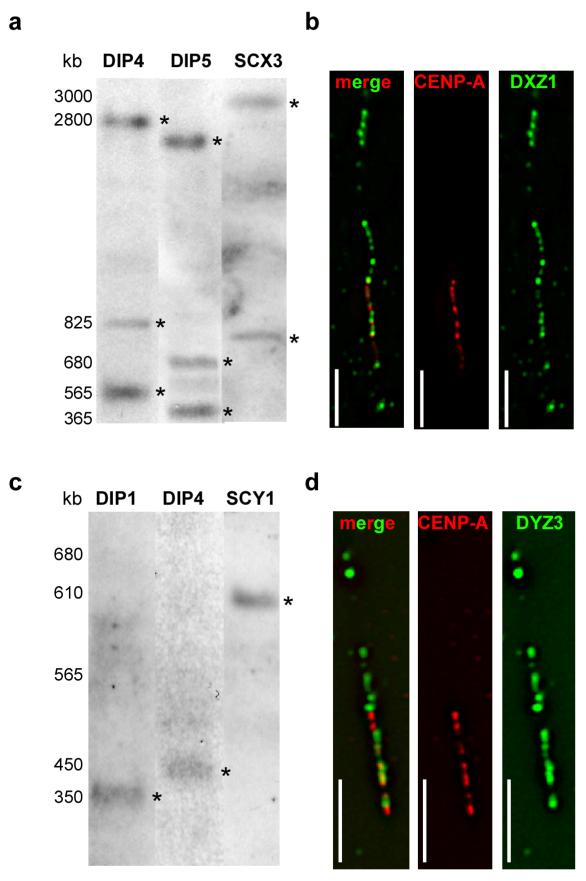
Figure 2. Alpha satellite array size and CENP-A domain size at centromeres of chromosomes X and Y.
Molecular sizes of alpha satellite arrays were determined by pulsed field gel electrophoresis (PFGE) of high molecular weight DNA embedded in agarose, followed by non-radioactive Southern blotting. (a) Sizes of X alpha satellite (DXZ1) arrays in two diploid lines (DIP4, DIP5) and a mouse-human somatic cell hybrid containing a single human X chromosome (SCX3) ranged from 3.7-4.2Mb. The total array size for DXZ1 in each cell line was estimated by adding the molecular weights of all bands that appeared in the Southern blot. Digestion of DNA embedded within agarose plugs with BglI (shown) or BstEII (not shown) released DXZ1 as two or three bands that were detected by Southern blotting. High molecular weight bands are denoted with asterisks (*). PFGE conditions for DXZ1 were 3 V/cm, initial switch time of 250s, and a final switch time of 900s, for 50 hours. The figure shows three cell lines that were run on separate but identically sized gels under identical conditions using the same high molecular weight standards. The gel for each cell line was cropped identically and aligned according to the molecular weight standards. (b) CENP-A domains sizes were determined using CENP-A immunostaining on extended chromatin fibers followed by FISH with a DNA probe specific for DXZ1. Domain sizes were calculated by assigning molecular sizes as determined by PFGE to the length of the alpha satellite signals (in micrometers). CENP-A domains were calculated by comparing the length of the immunostaining on the fiber to the length of the alpha satellite fluorescent signal (see Materials and Methods for additional details). The representative image from cell line DIP3 shows CENP-A (red) immunostaining overlapping with only a portion of DXZ1 (green). The merged image is shown on the left, followed by individual image channels for CENP-A (middle) and DXZ1 (right). Scale bar is 10 micrometers. (c) Molecular sizing of Y alpha satellite (DYZ3) arrays in two diploid lines (DIP1, DIP4) and a mouse-human somatic cell hybrid containing a single human Y chromosome (SCY1) showed arrays that ranged from 350-600kb. Digestion of DNA embedded within agarose plugs with BamHI released the entire DYZ3 array that was detected by Southern blotting as a single band. High molecular weight bands are denoted with asterisks (*). PFGE parameters were 6 V/cm, 10s initial switch time, 80s final switch time, for 23 hours. The figure shows three cell lines that were run on separate but identically sized gels under identical conditions and using the same high molecular weight standards. The gel for each cell line was cropped identically and aligned according to the molecular weight standards. (d) Representative image from cell line DIP4 showing CENP-A (red) immunostaining overlapping with a portion of DYZ3 (green). The merged image is shown on the left, followed by individual image channels for CENP-A (middle) and DYZ3 (right). Scale bar is 5 micrometers.

