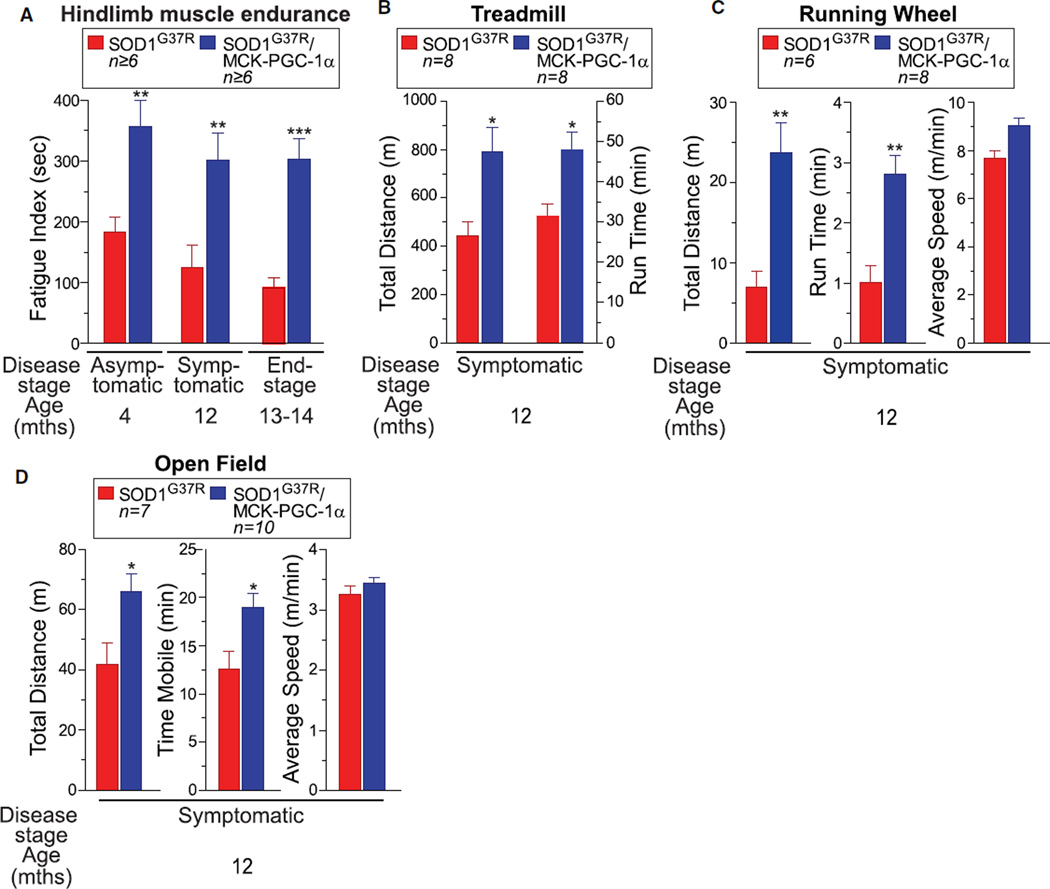
Figure 2. Elevating PGC-1α Expression Improves Muscle Activity and Locomotive Activity in Mutant SOD1G37R Mice.
(A) Fatigue index of hindlimb muscles from SOD1G37R and SOD1G37R/MCK-PGC-1α animals throughout disease. Fatigue index was quantified as the period (in seconds) of high-frequency electrical stimulation required to obtain a 50% decrease in muscle contraction. Data are presented as mean ± SEM. See also Figure S2.
(B) Treadmill performance (total distance and run time on the treadmill determined until exhaustion) of SOD1G37R and SOD1G37R/MCK-PGC-1α animals at the symptomatic stage of disease. Data are presented as mean ± SEM.
(C) Running wheel performance of SOD1G37R and SOD1G37R/MCK-PGC-1α animals at the symptomatic stage of disease. Total distance and run time on the wheel were determined during a 5 min testing period. Average speed corresponds to the mean speed of running during the mobile period. Data are presented as mean ± SEM.
(D) Open field performance of SOD1G37R and SOD1G37R/MCK-PGC-1α animals at the symptomatic stage of disease. Total distance covered and the time mobile were determined during a 60 min of tracking period. Average speed corresponds to the mean speed of movement during the mobile period. Data are presented as mean ± SEM.

