Figure 2.
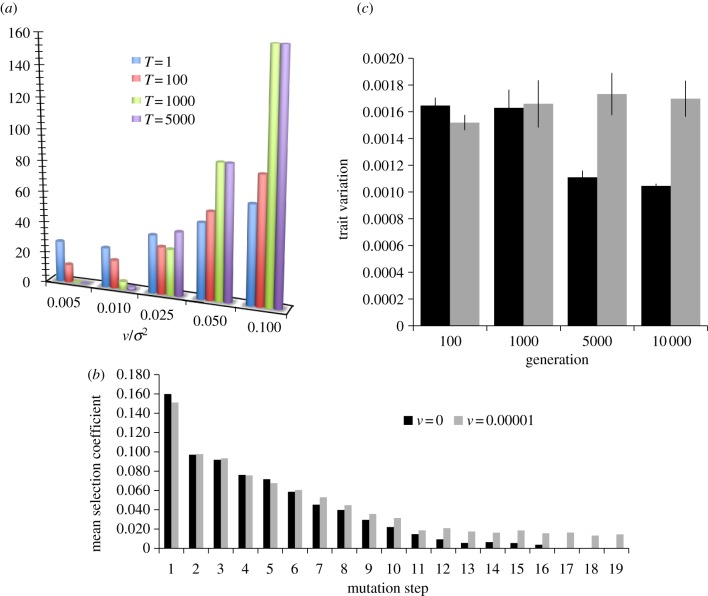
(a) Relative probability of fixation of a mutator (mutator advantage), with strength smut = 100, introduced at generation T (different bar colours). N = 104 σ2 = 0.001, n = 20, U = 0.001, W0 = 0.8. (b) Mean fitness effect of fixed mutations along the adaptive walk. The black bars represent a static landscape (v = 0), and the grey bars a randomly shaking optimum. N = 106 σ2 = 0.001, n = 20, U = 0.001, W0 = 0.5. (c) The mean within-population variance in trait values observed along the adaptive walk (at generation 10 000 the fitness plateau was already achieved). Black bars represent a static landscape (v = 0), and grey bars a randomly shaking optimum (v = 10−5). N = 105 σ2 = 0.001, n = 20, U = 0.001 and W0 = 0.5.

