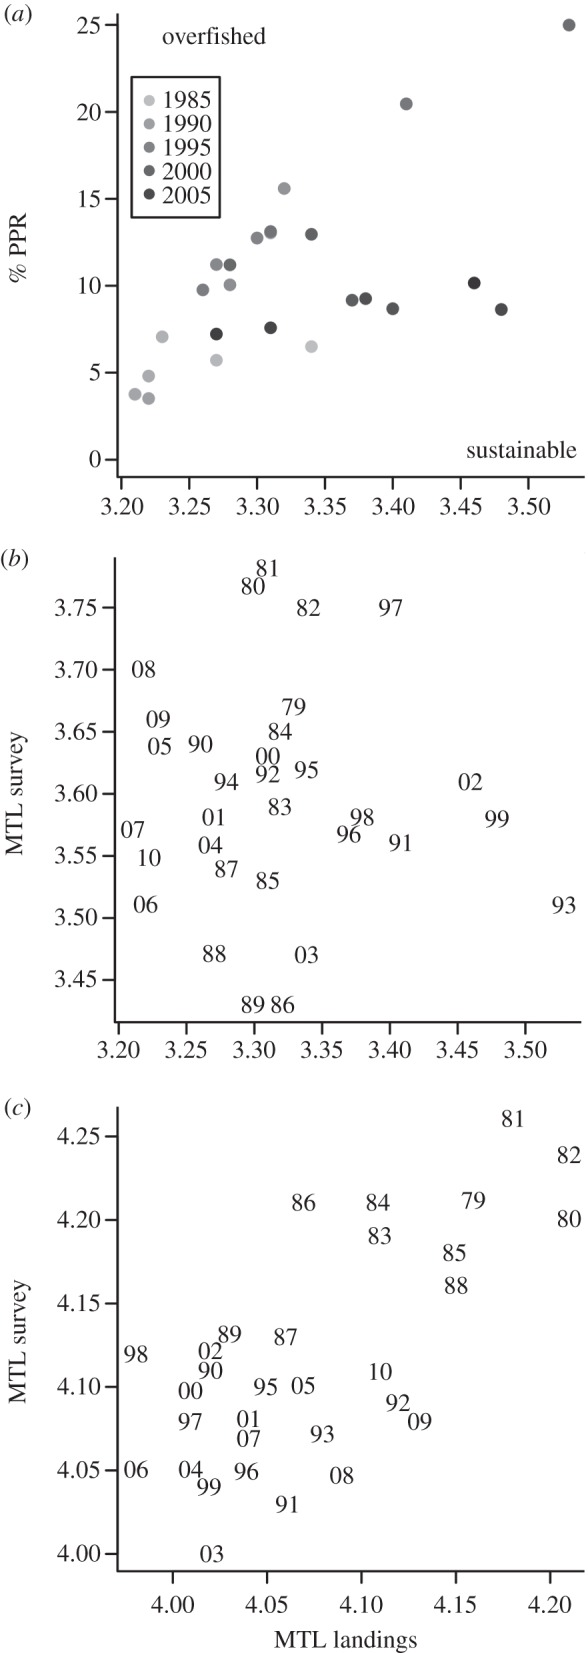
Figure 2.

In (a) landings are expressed as % PPR out of total ecosystem production plotted against MTL, format adopted from [2]. In (b), MTL based on survey data (1979–2010) are compared with landings (fish and commercial crustaceans) and in (c) MTL for species with a TL more than 3.25 are compared with landings using the same data as shown in (b).
