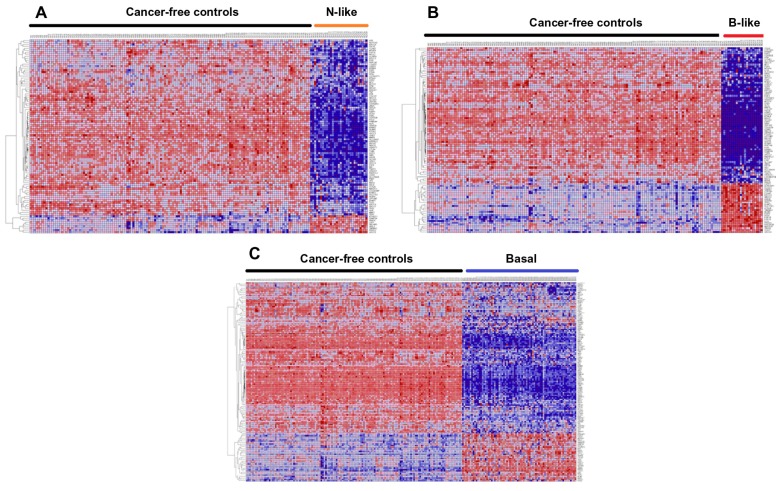
Figure 3.
Patterns of gene expression profiles for genes containing SNPs associated with an increased risk associated with an increased risk of developing breast cancer, which were highly significantly (P <10−6) associated with TNBC subtypes. (A) shows patterns of expression profiles for the 98 SNP- containing genes obtained by comparing expression profiles between normal-like breast cancer patients (N = 29) and 142 cancer-free controls. (B) Patterns of gene expression profiles for the 101 SNP-containing genes in basal-like patients (N = 20) and 142 cancer-free controls. (C) Patterns of gene expression profiles for the 142 SNP-containing genes in non-luminal basal patients (N = 75) and 142 cancer-free controls.
Notes: Genes are represented in the roles and samples in the columns. Red and blues colors indicate up and down regulation, respectively.

